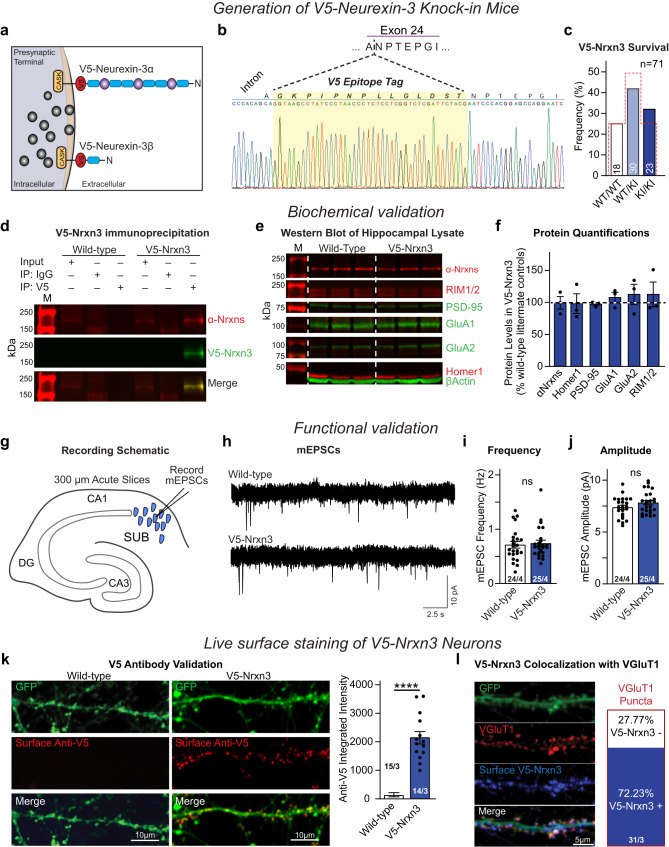
Fig. 4. Homozygous V5-Nrxn3 knock-in mice show no deficits in survival, synaptic protein expression, or synaptic function and are suitable for Nrxn3 localization.
a Schematic of the V5-tag knock-in site. b Sanger Sequencing validation of F1 V5-Nrxn3 mice. c Survival rates of offspring from heterozygous V5-Nrxn3 mice (expected Mendelian ratio = red outline) p = 0.2999 χ2 test, n = 71 mice. d–f Immunoprecipitation of V5-Nrxn3 from whole brain lysate (d). Representative Western blots of excitatory synaptic proteins from wildtype littermate (left) and V5-Nrxn3 (right) mice (e). Western blot quantification of synaptic proteins in V5-Nrxn3 mice (f) α-Nrxns, p = 0.5456; Homer1, p = 0.9076; PSD-95, p = 0.3289; GluA1, p = 0.4543; GluA2, p = 0.5144; or RIM1/2, p = 0.5853. One sample t test (two-tailed), n = 3 independent animals for each condition. M: molecular weight ladder. g–j Functional analysis of V5-Nrxn3 mice. Recording schematic (g). Representative mEPSCs from V5-Nrxn3 and wild-type littermate controls (h). mEPSC frequency (i); (p = 0.7493). mEPSC amplitude (j); (p = 0.1275). Wildtype: 24 cells from 4 independent animals; V5-Nrxn3: 25 cells from 4 independent animals. Significance: unpaired t test (two-tailed). k Representative confocal images (left) of surface anti-V5 labeling of wildtype and V5-Nrxn3 neurons. Quantification (right) of surface expression of V5-Nrxn3; n = 15 Wild-type and n = 14 V5-Nrxn3 cells from 3 independent experiments unpaired t-test (two-tailed). l Representative image (left) and summary graphs of V5-Nrxn3 co-localization with vGluT1 (right). Number of neurons and independent experiments are indicated in the figure. Bar graphs indicate mean ± SEM. ****p < 0.0001. Source data are provided as a Source Data file.

