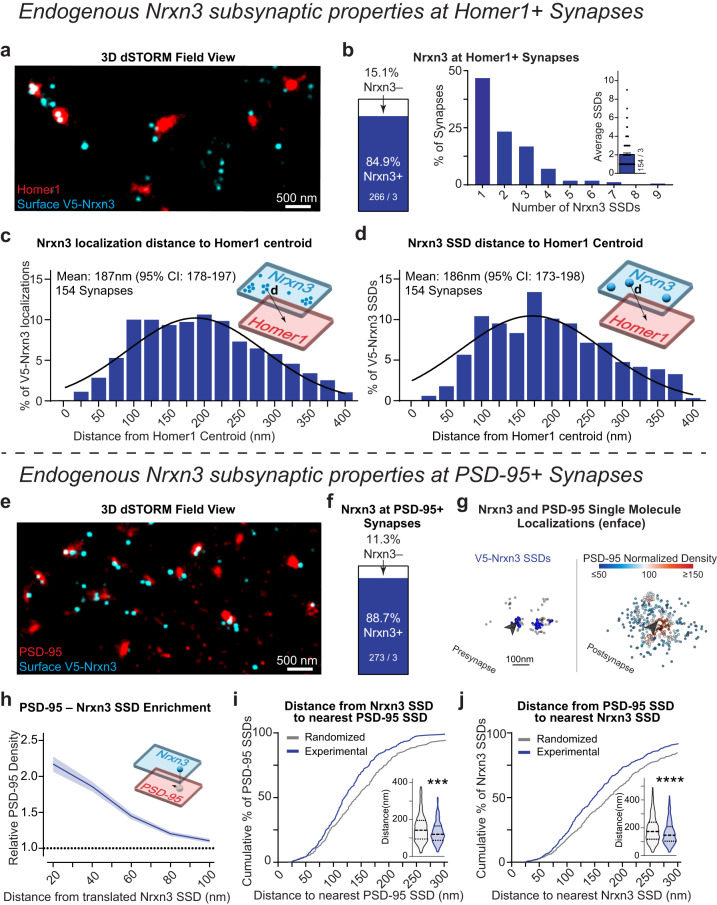
Fig. 5. Endogenous neurexin-3 is present at the majority of excitatory synapses and localizes near the synaptic nanocolumn.
a Representative 3D dSTORM of endogenous V5-Nrxn3 (cyan) and Homer1 (red). b V5-Nrxn3 Homer1 synaptic abundance (left) and number of SSDs (right). Distribution of Nrxn3 localization distance (c) and SSD distance (d) to the centroid of Homer1. Mean and 95% confidence interval of the Gaussian fitted distribution indicated on the graph. e Representative 3D dSTORM of V5-Nrxn3 (cyan) and PSD-95 (red). f Same as (b) for PSD-95+ synapses. g Distributions of synaptic of V5-Nrxn3 (left) and PSD-95 (right). Blue spheres identify V5-Nrxn3 SSDs opposite a PSD-95 of varying density (heatmap). Arrow identifies V5-Nrxn3 SSD that opposes a region of high PSD-95 density. h Enrichment analysis of PSD-95 density opposite Nrxn3 SSDs. n = 154 synapses. i Nearest neighbor distance from Nrxn3 SSDs to the closest PSD-95 SSD is left-shifted compared to randomized data. Violin plot (inset) of nearest neighbor distances, p = 0.0004; Mann–Whitney test (two-tailed). n = 303 experimental and randomized SSDs. j Same as in H, except for nearest neighbor distances of PSD-95 SSDs to nearest Nrxn3 SSD compared to randomized data. Violin plot (inset) of nearest neighbor distances, p < 0.0001; Mann–Whitney test (two-tailed). n = 465 experimental and randomized SSDs. Data from three independent experiments. Number of synapses indicated on the graph unless stated in the legend. Bar graphs and line graphs: average ± SEM. ***p < 0.001; ****p < 0.0001. Source data are provided as a Source Data file.

