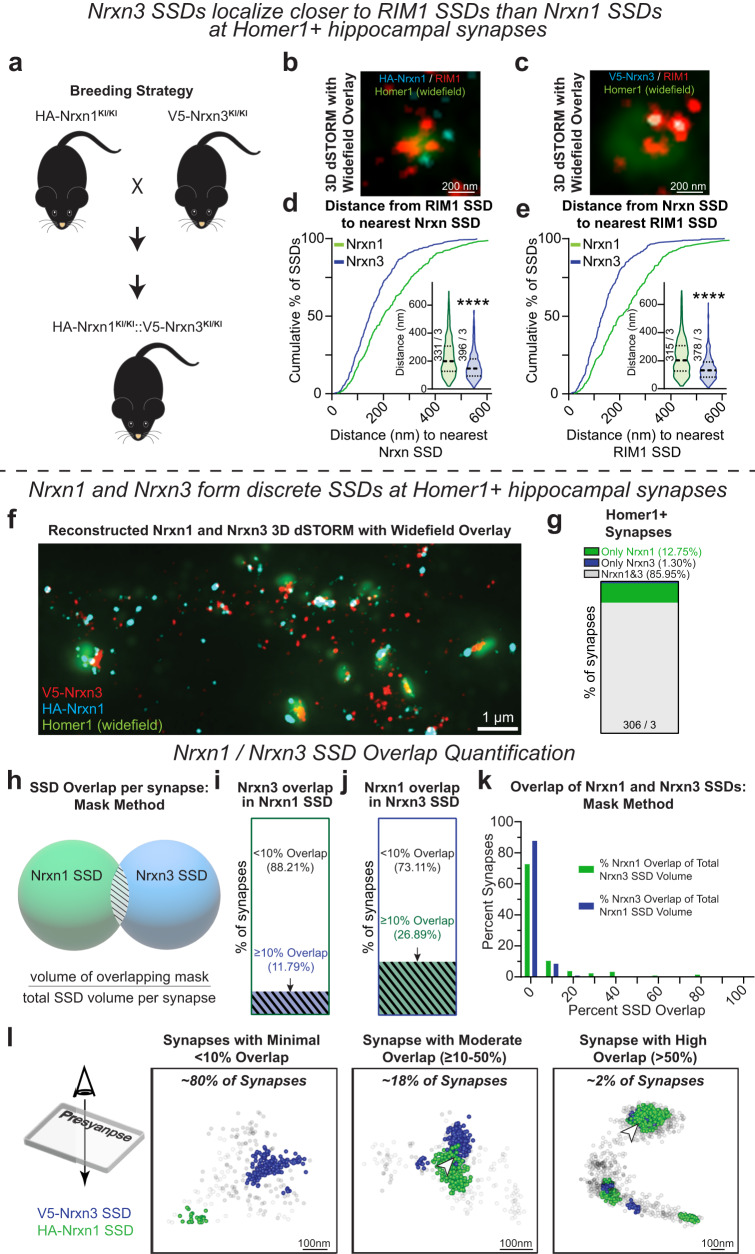
Fig. 8. Nrxn1 and Nrxn3 form discrete SSDs at Homer1+ hippocampal synapses.
a Breeding strategy to create HA-Nrxn1KI/KI::V5-Nrxn3KI/KI mice. Representative 3D dSTORM field view of Nrxn1 (b); (cyan) or Nrxn3 (c); (cyan) and RIM1 (red) with a widefield Homer1 overlay (green). The nearest neighbor distance is shorter from RIM1 SSDs to Nrxn3 SSDs than to Nrxn1 SSDs, p < 0.0001; (d) and from Nrxn3 SSDs to RIM1 SSDs, p < 0.0001; (e). Significance: Mann–Whitney test (two-tailed). f Representative 3D dSTORM field view of Nrxn3 (red) and Nrxn1 (cyan) with a wide field Homer1 overlay (green). g Stacked bar graph of excitatory synapses with ≥5 Nrxn1 and/or Nrxn3 localizations. h Schematic of the overlap mask method. SSD overlap is determined by quantifying the volume overlap of Nrxn1 and Nrxn3 SSDs masks. Stacked bar graph of the SSD volume overlap of Nrxn3 with Nrxn1 (I) and Nrxn1 with Nrxn3 (J). n = 212 synapses. (k) Histogram of the percent overlap of Nrxn1 and Nrxn3 SSDs using the overlapping mask method. n = 212 synapses. l Representative scatter plots depicting Nrxn1 SSDs (green) and Nrxn3 SSDs (blue) showing minimal (<10%, left), moderate (10–50% middle), and high (>50%, right) overlap of SSDs. Data from three independent experiments. Number of synapses indicated on the graph unless stated in the legend. Violin plots: median ± upper and lower quartiles. ****p < 0.0001. Source data are provided as a Source Data file.

