Figure 2.
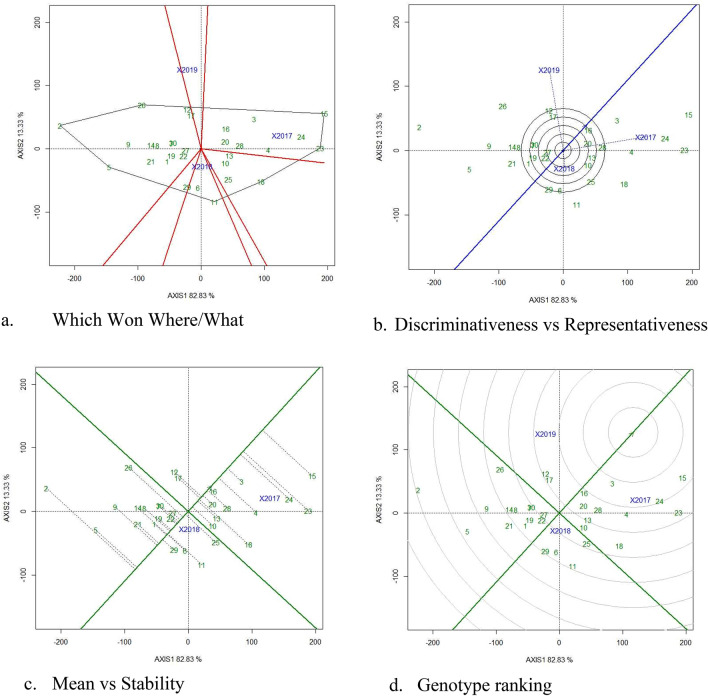
GGE Biplots of for pod yield (g/m2) under drought stress. The data is not transformed, not scaled, environments were centered (Centering = 2) and the biplots based on singular value partition by column metric preserving. The Biplots explained 79.86 percent of G + GE. (a) Which won where/what GGE biplot to visualise the mega environment and environment specific genotypes. (b) discriminativeness vs representativeness GGE biplot depicting the longest environment vector and nearer to average environmental coordinates and identified 2018 as highly discriminative environment, (c) mean vs stability GGE biplot depicting the 18 and 23 located in the direction oGGE biplotf the average environmental, (d) Ranking of genotype GGE biplot depicting the genotype 11 located in near to ideal genotype for pod yield (g/m2). 1, Abhaya; 2, AK 265; 3, Anantha; 4, CSMG 84-1; 5, Dh3-30; 6, Dharani; 7, DRG 17; 8, DSG 41; 9, GG 2; 10, Girnar 2; 11, GPBD 5; 12, ICGS 1; 13, ICGS 44; 14, ICGS 76; 15, ICGV 86031; 16, ICGV 86325; 17, ICGV 91114; 18, K 6; 19, K 9; 20, Kadiri 5; 21, Kadiri Hariandra; 22, Mutant 3; 23, R 2001-2; 24, R 2001-3; 25, R 8808; 26, Spanish Improved; 27, TAG 24; 28, TDG 39; 29, TG 72; 30, TMV 2.

