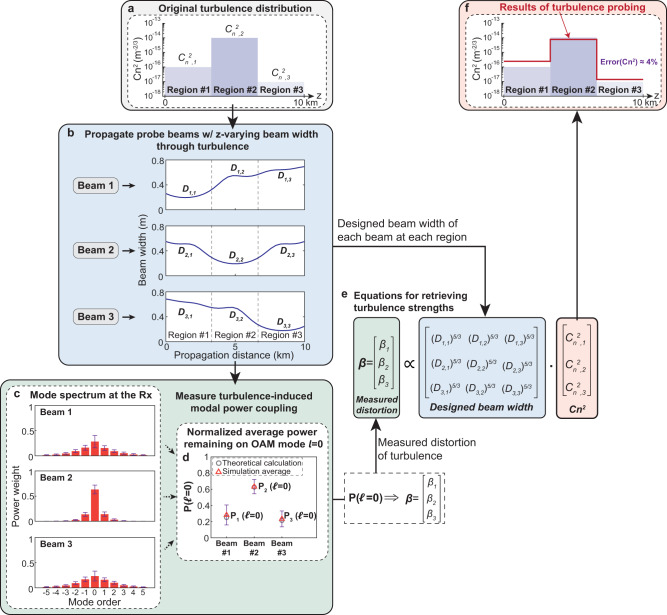
Fig. 2. Procedures of our approach for probing a turbulence distribution with three different turbulence regions.
a Three equal-length turbulence regions in simulation with each region having a different turbulence strength of . b Simulated beam widths ( for each beam i in each region j) of the three beams designed for turbulence probing. c Simulated average modal spectrum for the three beams at the Rx under 200 turbulence realizations. The bars show the standard deviation for the simulation results. d Normalized average power remained on the for the three beams (e.g., for Beam i) in the simulation. e Constructed equations for retrieving the turbulence distribution. f Probed turbulence distribution in simulation. The simulated relative probing error is ~4% (~0.2 dB from the original value) for this example of probing three turbulence regions.

