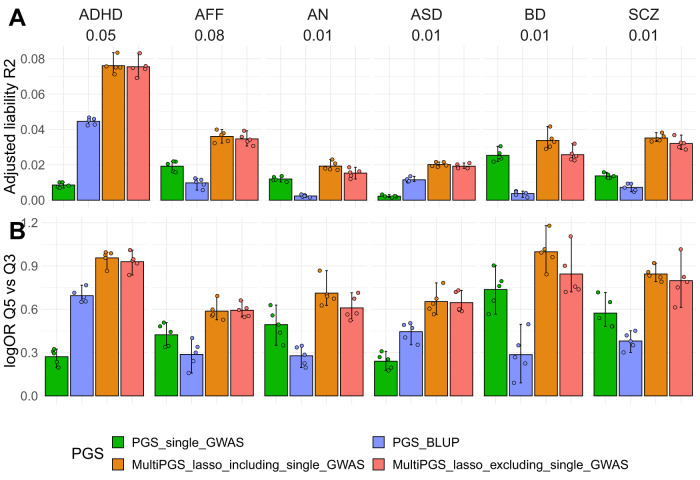
Fig. 4. Performance of the PGS trained with different data.
Comparison between the per-disorder attention-deficit/hyperactivity disorder (ADHD), affective disorder (AFF), anorexia nervosa (AN), autism spectrum disorder (ASD), bipolar disorder (BD) and schizophrenia (SCZ) single GWAS PGS (PGS_single_GWAS) (Details on SD2), the per-disorder BLUP PGS and the multi-PGS in terms of A liability adjusted R2 and B log odd ratios of the top quintile compared to the middle quintile. The multiPGS_lasso_excluding_single_GWAS represents the PGS where the specific single GWAS PGS was removed from the set of 937 PGS. All models were adjusted for sex, age and first 20 PCs. The adjusted liability R2 shows the mean of the fivefold cross-validation training-testing subsets. CI were calculated from 10k bootstrap samples of the mean adjusted R2 or logOR, where the adjusted R2 was the variance explained by the full model after accounting for the variance explained by a logistic-regression covariates-only model as R2_adjusted = (R2_full − R2_cov)/(1 − R2_cov). Prevalences used for the liability are shown beneath each disorder label and case-control ratios are available on SD2. All association OR for all quintiles are available in SF14.

