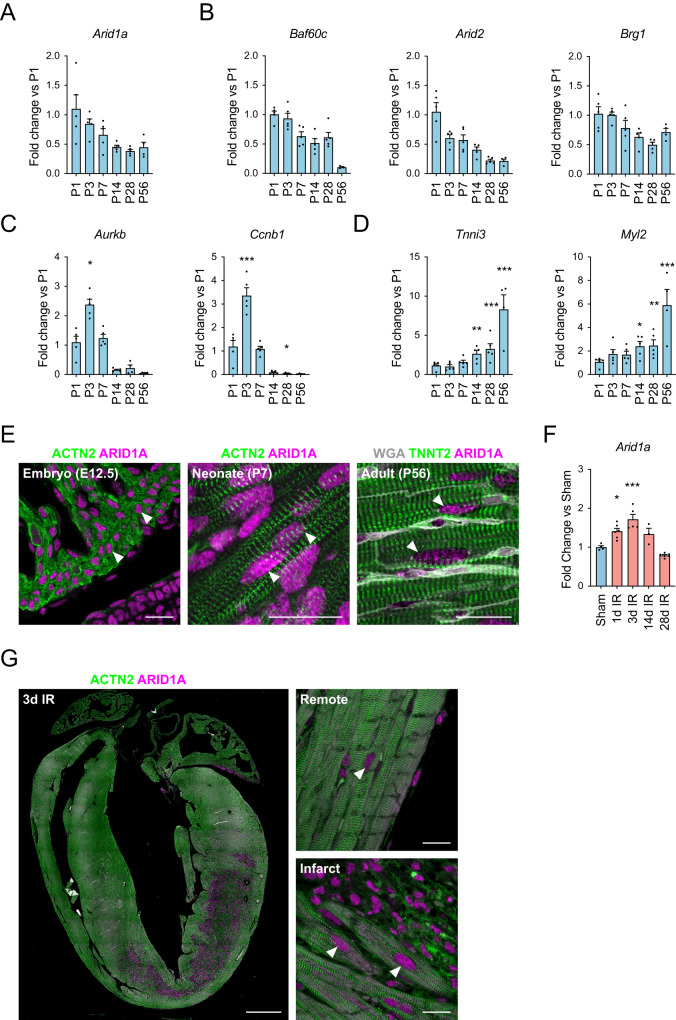
Fig. 1. Arid1a expression during postnatal heart maturation.
A–C Real-time quantitative PCR (qPCR) determined levels of gene expression during postnatal cardiac development. Levels are shown as fold change over P1 for (A) Arid1a, (P1-P28: n = 5, P56: n = 4) (B) other SWI/SNF complex subunits Baf60c (P1-P28: n = 5, P56: n = 3), Arid2 (P1-P28: n = 5, P56: n = 4) and Brg1 (P1-P28: n = 5, P56: n = 4), (C) proliferation markers Aurkb (P1-P14: n = 5, P28,P56: n = 4; P3 P = 0.0214) and Ccnb1 (P1-P28: n = 5, P56: n = 4; P3 P < 0.0001, P28 P = 0.0498), and (D) cardiomyocyte maturation markers Tnni3 (P1-P28: n = 5, P56: n = 4; P14 P = 0.0043, P28 P < 0.0001; P56 P < 0.0001) and Myl2 (P1-P28: n = 5, P56: n = 4; P14 P = 0.0156, P28 P = 0.0096, P56 P < 0.0001). E Representative example of immunofluorescence staining for ARID1A (red) in embryonic (E12.5; n = 3), postnatal (P7; n = 4) and adult (8-10w; n = 4) mouse cardiomyocytes (ACNT2 or TNNT2, green). Extracellular matrix is highlighted by WGA staining in the adult section. F Arid1a expression (qPCR) in sham (n = 4) and at 1 (n = 6; P = 0.0099), 3 (n = 5; P < 0.0001), 14 (n = 3) and 28 (n = 6) days (d) after ischemia-reperfusion injury (IR). G ARID1A expression in mouse heart 3 days post IR (n = 5). Arrowheads mark ARID1A positive cardiomyocyte nuclei near infarct area. Scale bars 1 mm (G, left panel), 20 µm (E; G right panels). Bar graphs show mean and standard error of the mean; one-way ANOVA with Dunnett’s test for multiple comparisons, compared to P1 (A–D) or Sham (F): *P < 0.05; **P < 0.01; ***P < 0.001. Source data are provided as a Source Data file.

