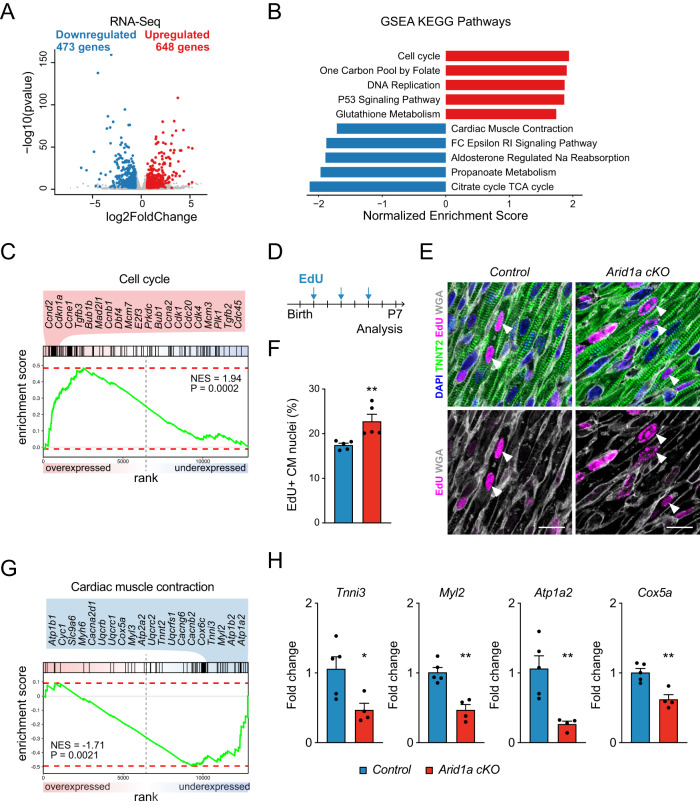
Fig. 3. Increased proliferation and decreased maturation in Arid1a cKO cardiomyocytes.
A Volcano plot of RNA-Seq on P7 hearts with 473 genes downregulated (blue) and 648 genes upregulated (red) in Arid1a cKO (n = 4) compared to control (n = 5) hearts (Differentially expressed genes are defined as those genes with an absolute fold change >1.5x and Wald-test with Benjamini-Hochberg-adjusted P < 0.05). B Gene set enrichment analysis (GSEA) for Kyoto encyclopedia of genes and genomes (KEGG) identified pathways activated (red) or suppressed (blue) in Arid1a cKO compared to control hearts. C GSEA enrichment plot with most significantly induced cell cycle genes in Arid1a cKO hearts. D Schematic showing EdU incorporation assay timeline. EdU was administered to neonates at P1, P3 and P5. Hearts were analyzed at P7. E Representative example of EdU staining (magenta) in P7 Arid1a cKO and control hearts, co-stained with TNNT2 (green) and WGA (gray) to identify cardiomyocytes. Scale bars 20 µm. F Quantification of EdU incorporation in P7 control and Arid1a cKO hearts (n = 5; P = 0.0079). **P < 0.01, two-tailed Mann–Whitney test. G GSEA enrichment plot with most significantly suppressed cardiac muscle contraction genes in Arid1a cKO hearts. H Levels of mRNA transcripts encoding sarcomeric proteins (Myl2, P = 0.0012; Tnni3, P = 0.0269, ion channels (Atp1a2, P = 0.0066) and energy metabolism (Cox5a, P = 0.0032) in Arid1a cKO (n = 4) and control hearts (n = 5) as determined by qPCR). *P < 0.05; **P < 0.01, two-tailed Student’s t-test. All bar graphs show mean with standard error of the mean. Source data are provided as a Source Data file.

