
Figure 1. WSD induces jejunal mucus barrier dysfunction.
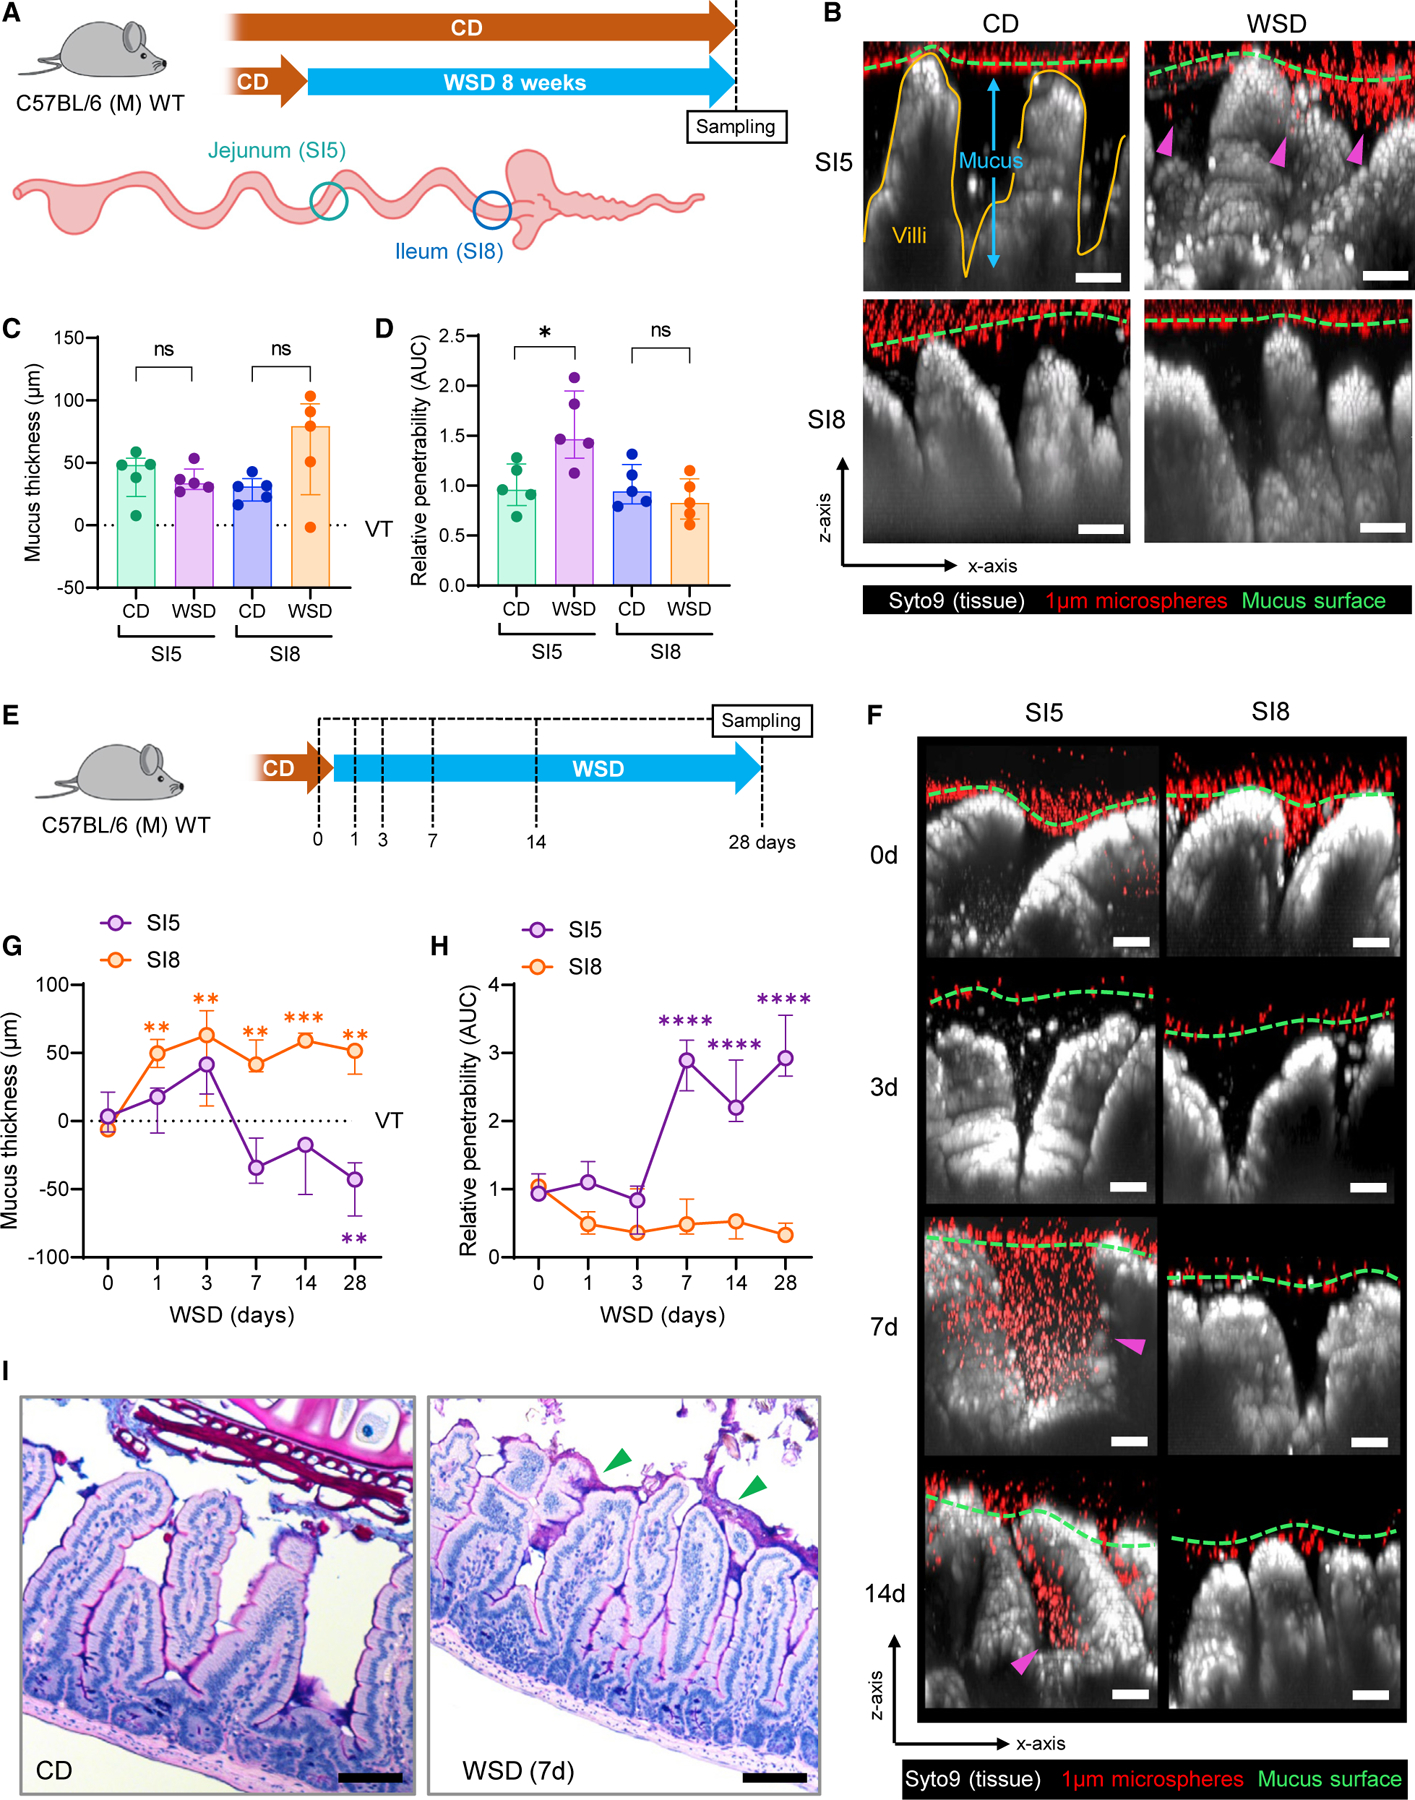
(A) Schematic illustrating CD and WSD experimental groups and intestinal tissue sampling points.
(B) Confocal z stacks showing x/z axis cross sections of ex vivo SI5 and SI8 tissue (gray) and 1-µM microspheres (red) from CD and WSD-fed mice; approximate mucus surface (green dashed line) and microspheres penetrating into mucus (magenta arrows) indicated.
(C and D) Quantification of mucus thickness (C) relative to villus tips (VTs) and relative barrier function (D) based on data extracted from images shown in (B). Data in (D) are normalized to CD group mean.
(E) Schematic illustrating sampling points for WSD time course.
(F) Confocal z stacks showing x/z axis cross sections of SI5 and SI8 tissue (gray) and 1-µM microspheres (red) from WSD-fed mice at different time points; approximate mucus surface (green dashed line) and microspheres penetrating into mucus (magenta arrows) indicated.
(G and H) Quantification of mucus thickness (G) relative to villus tips (VTs) and relative barrier function (H) based on data extracted from images shown in (F). Data in (H) are normalized to day 0 group mean.
(I) Alcian blue/periodic acid-Schiff (AB/PAS)-stained fixed tissue sections from CD and WSD-fed mice. Images are representative of n = 5/group. All image scale bars are 50 µM. Data show median and interquartile range for n = 5 (C, D) and n = 3 (G, H) mice per group. Significance by Mann-Whitney (C, D) or Dunnett’s (G, H) test (*p < 0.05, **p < 0.01, ***p < 0.001, p < 0.0001, ns: not significant).