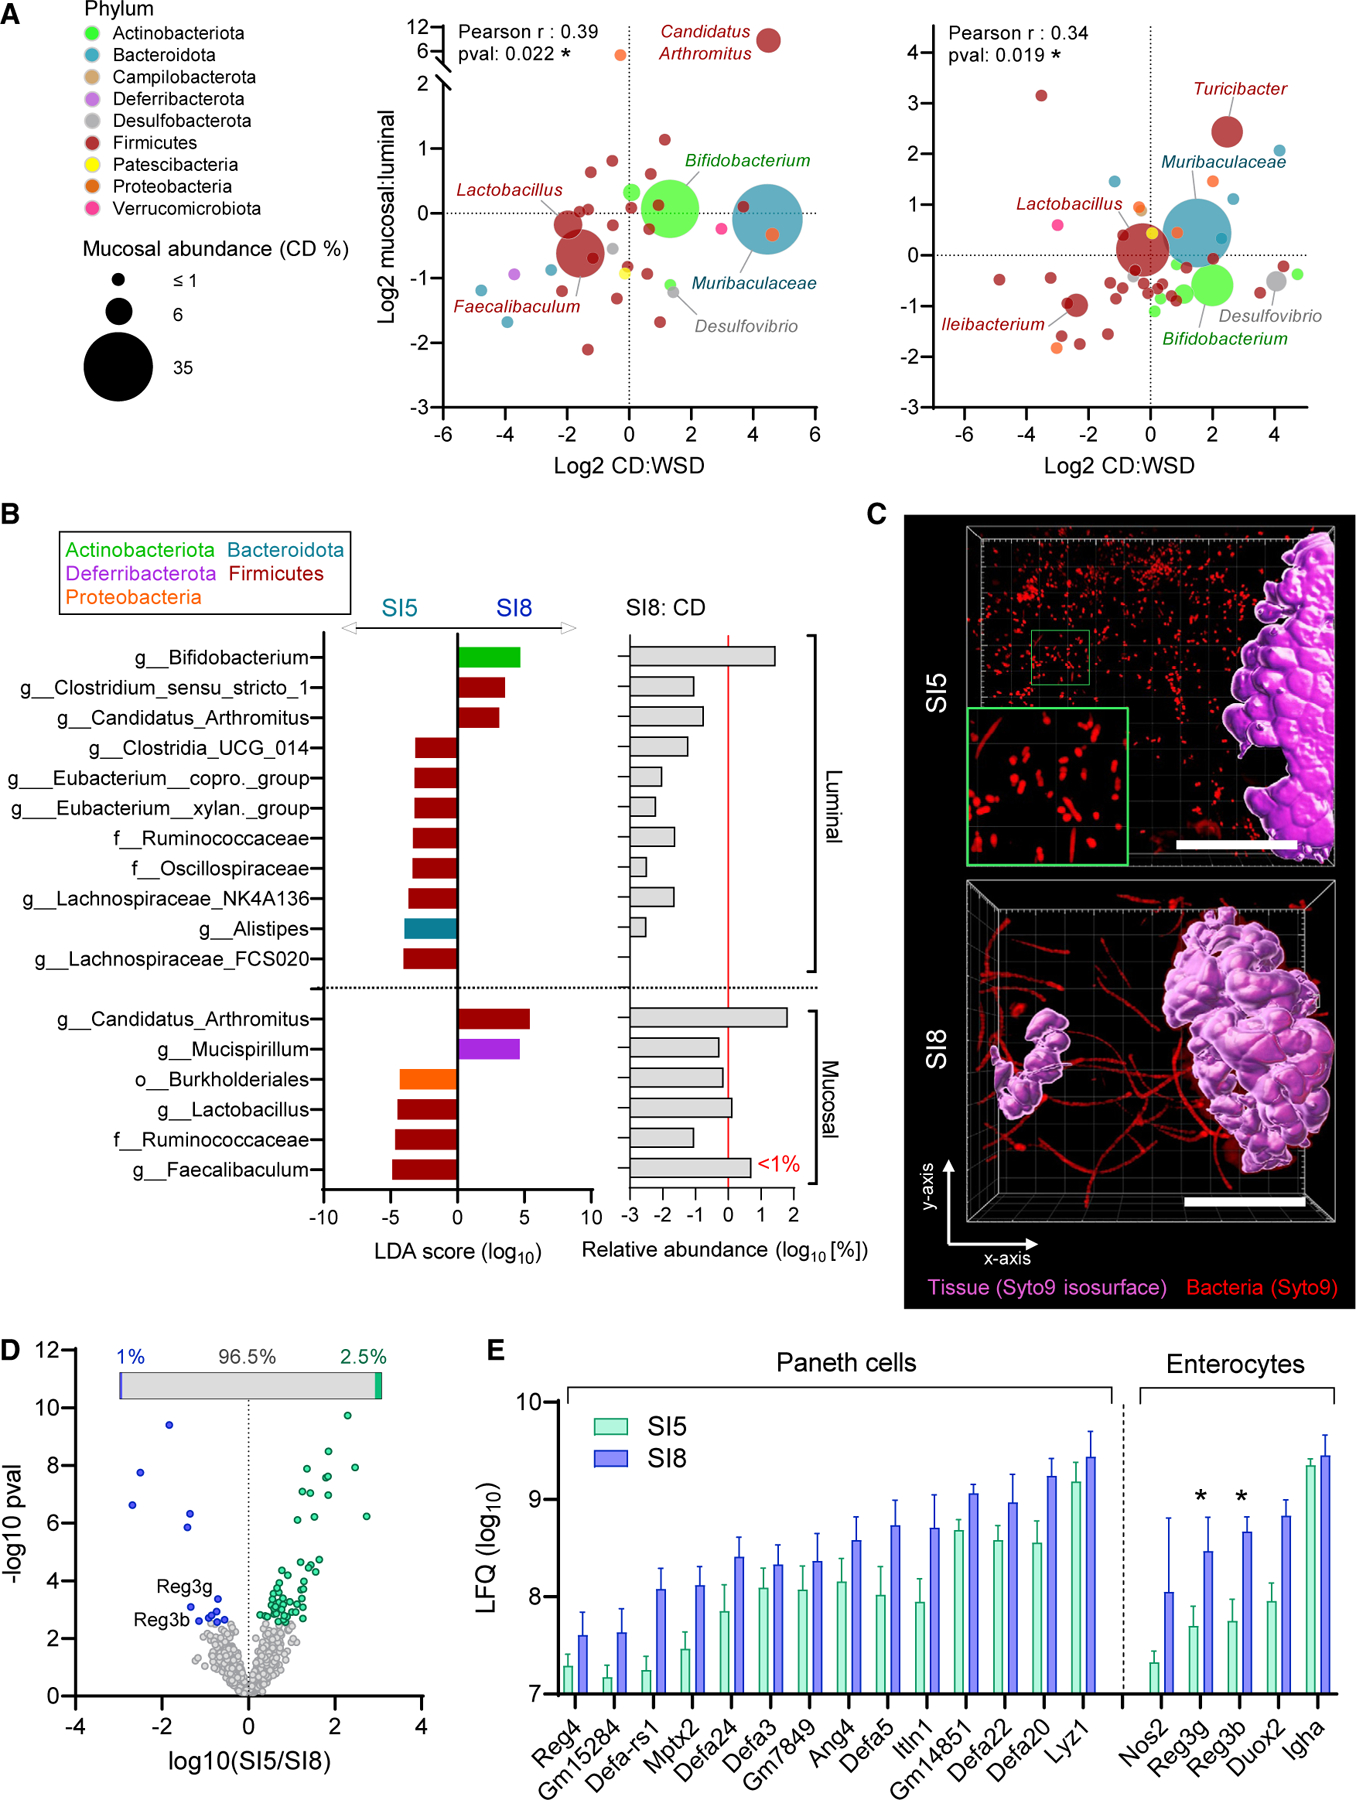
Figure 6. Microbial and host factors in the jejunal and ileal mucus niche.

(A) Comparison of log2 mucosal:luminal and CD:WSD ratios for bacterial taxa detected in SI5 mucosal samples of CD and WSD-fed mice by 16S rRNA gene sequencing. Panels show data from independent experiments detailed in Figure 2 (left) and Figure 5 (right); data points represent individual taxa color coded by phylum and sized by median mucosal relative abundance (RA) in CD-fed mice.
(B) Linear discriminant analysis (LDA) effect size identification of bacterial taxa significantly enriched in SI5 or SI8 luminal and mucosal microbiota (left panel) aligned with the relative abundance of bacterial taxa in SI8 of CD-fed mice (right panel). Red line indicates a relative abundance of 1%.
(C) Ex vivo confocal microscopy imaging of tissue (purple isosurface) and bacteria (red) in SI5 and SI8 of CD-fed mice. Images are confocal z stacks showing x/y axis projections and a magnified image of planktonic bacterial cells in SI5 (green panel).
(D and E) Mass spectrometry-based label-free quantification (LFQ) and comparison of SI5 and SI8 mucus proteomes from CD-fed mice. Volcano plot illustrating proteins significantly more abundant in either SI5 or SI8 (D); inset shows proportion of discriminant proteins as a percentage of all detected proteins. Abundances of all detected Paneth cell and enterocyte-specific antimicrobial proteins (E). All image scale bars are 40 µm. Data show average values from n = 5–6 mice per group (A) or median and interquartile range for n = 8 mice per group with significance by t test and Permutation-based false discovery rate (*p < 0.05) (D, E).
