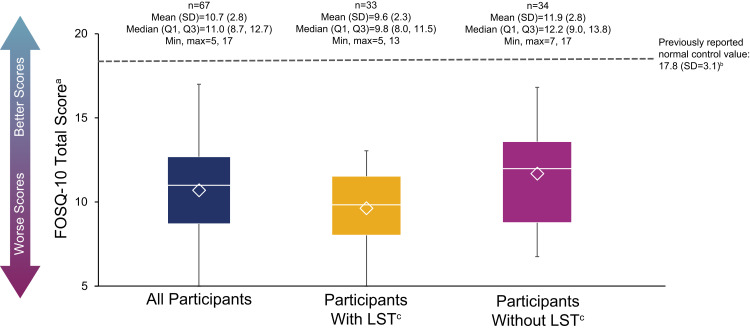
Figure 2.
FOSQ-10 scores. The bottom and top edges of the box indicate the first and third quartiles, the line inside the box is the median, and the marker inside the box is the mean. The whiskers extending from the box indicate the minimum and maximum values.
Notes: aRange of scores is 5–20; lower scores indicate worse impairment. bThe mean (SD) published normative value (ie, in individuals who do not experience sleepiness-related impairment), as reported in a prior clinical study.16cLong sleep was defined as ≥11 hours of sleep in a 24-hour period (self-reported).
Abbreviations: FOSQ-10, Functional Outcomes of Sleep Questionnaire, short version; LST, long sleep time; Max, maximum; Min, minimum; Q1, first quartile; Q3, third quartile; SD, standard deviation.

