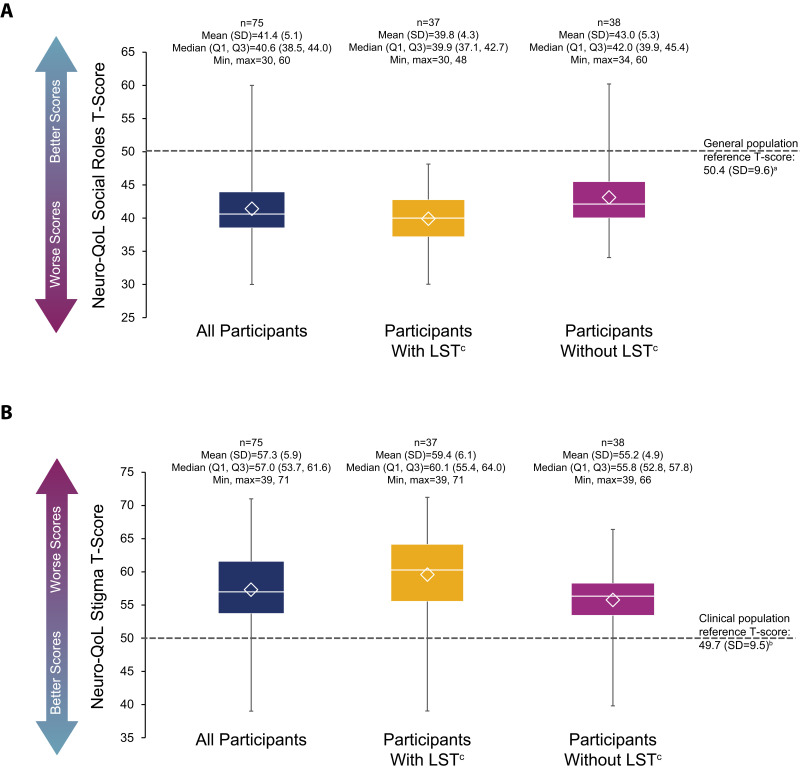
Figure 3.
Neuro-QoL short form scores in Social Rolesa (A) and Stigmab (B) domains. The bottom and top edges of the box indicate the first and third quartiles, the line inside the box is the median, and the marker inside the box is the mean. The whiskers extending from the box indicate the minimum and maximum values.
Notes: aAbility to participate in social roles and activities. Raw scores were converted into T-scores (mean, 50; SD, 10) for comparison with the mean score from a general reference population, as published in the Neuro-QoL User Manual. Range of possible T-scores is 24.1–60.2; higher scores indicate better outcomes.17bPerceptions of self and publicly enacted negativity, prejudice, and discrimination as a result of disease-related manifestations. Raw scores were converted into T-scores (mean, 50; SD, 10) for comparison with the mean score from a clinical reference population, as published in the Neuro-QoL User Manual. Range of possible T-scores is 39.2–81.5; higher scores indicate worse outcomes.17cLong sleep was defined as ≥11 hours of sleep in a 24-hour period (self-reported).
Abbreviations: LST, long sleep time; Max, maximum; Min, minimum; Neuro-QoL, Quality of Life in Neurological Disorders; Q1, first quartile; Q3, third quartile; SD, standard deviation.

