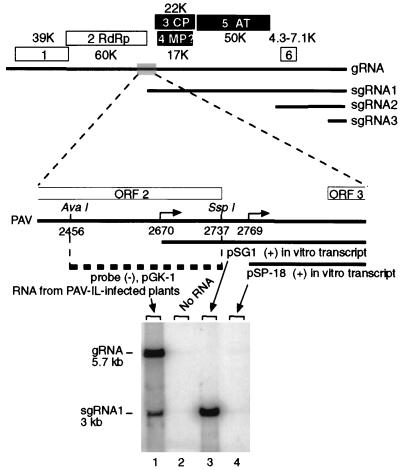
FIG. 1.
Mapping the 5′ end of sgRNA1 of BYDV. The upper part of the figure shows the genome organization of BYDV. Boxes represent ORFs (1 to 6) with the sizes of protein products indicated in kilodaltons. Thick horizontal lines represent gRNAs and sgRNAs. The lower part of the figure shows the putative sgRNA1 promoter region with the reported initiation sites indicated by right-angled arrows. sgRNA transcripts (which extend to the 3′ end of the genome) that represent sgRNA1s with 5′ ends determined by Kelly et al. (18) (pSG1) and by Dinesh-Kumar et al. (12) (pSP-18) are indicated by thick lines below the map. The probe for the Northern blot hybridization is complementary to the region of gRNA between nt 2456 and 2737 (pGK-1, dashed line). The Northern blot contains total RNA from infected plants (lane 1) or the indicated in vitro transcripts.

