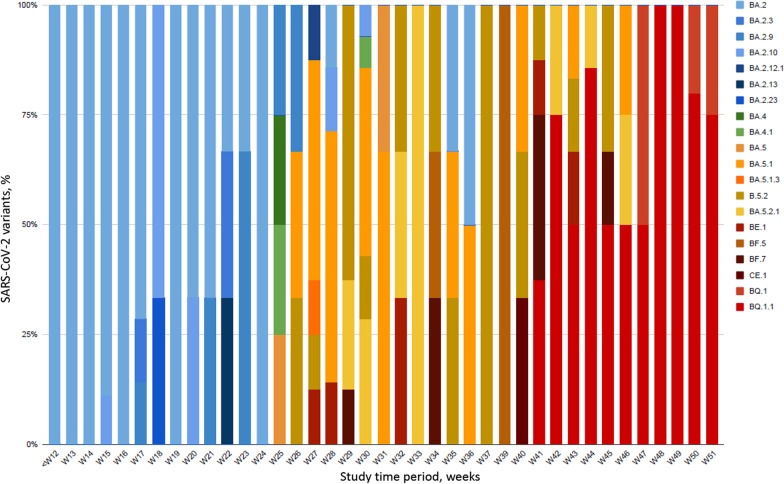
Fig. 2.
Dynamics of infecting SARS-CoV-2 variants during the 40-week study period. Patient-related samples (n = 158) corresponding to BA.2, BA.4, BA.5 and emerging sublineages are displayed over time. BA.2 sublineages are in blue, BA.4/BA.5 sublineages are in orange, brown, green and yellow and BQ.1.1 and other sublineages are in red, burgundy and black. The x-axis displays the study time period in weeks (w) from week 12, 2021 to week 51, 2022; The y-axis displays the percentage of each variant/sublineage at each time-point

