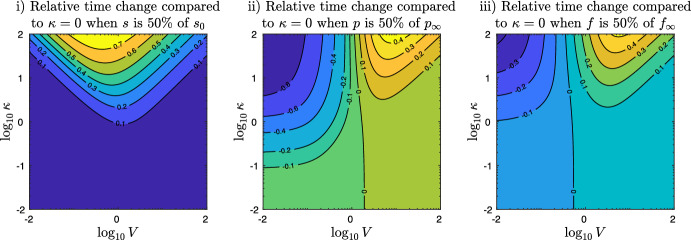
Fig. 5.
Relative time change of the simulation time of system (6) compared the same dynamics without DG transacylation, i.e. . The left image shows the relative time change for different values of the parameter V and at the time when 50% of the the initial substrate is processed. The middle image shows that the relative time change in order to produce 50% of the final product can be either negative or positive, representing cases where DG transacylation compensates for lacking DG hydrolysis or slows down MG production by substrate competition with DG hydrolysis. The right picture shows that also the relative time change in producing 50% of the final FAs can be negative or positive, representing cases when the feedback of DG transacylation into the TG pool allows TG hydrolysis to release additional FAs and when DG transacylation shows substrate competition with DG hydrolysis and thus slows down the release of FAs. The other parameters are (Color figure online)

