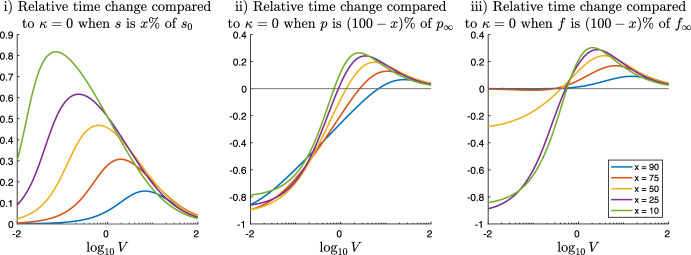
Fig. 6.
Relative time change of the simulation time of system (6) with and compared the same dynamics without DG transacylation . The left image i) plots the relative time changes for different percentages x of TG processing as functions of the parameter V. The middle and the right images (ii) and (iii) plot the relative time changes for the corresponding percentages of MG and FA production as functions of the parameter V (Color figure online)

