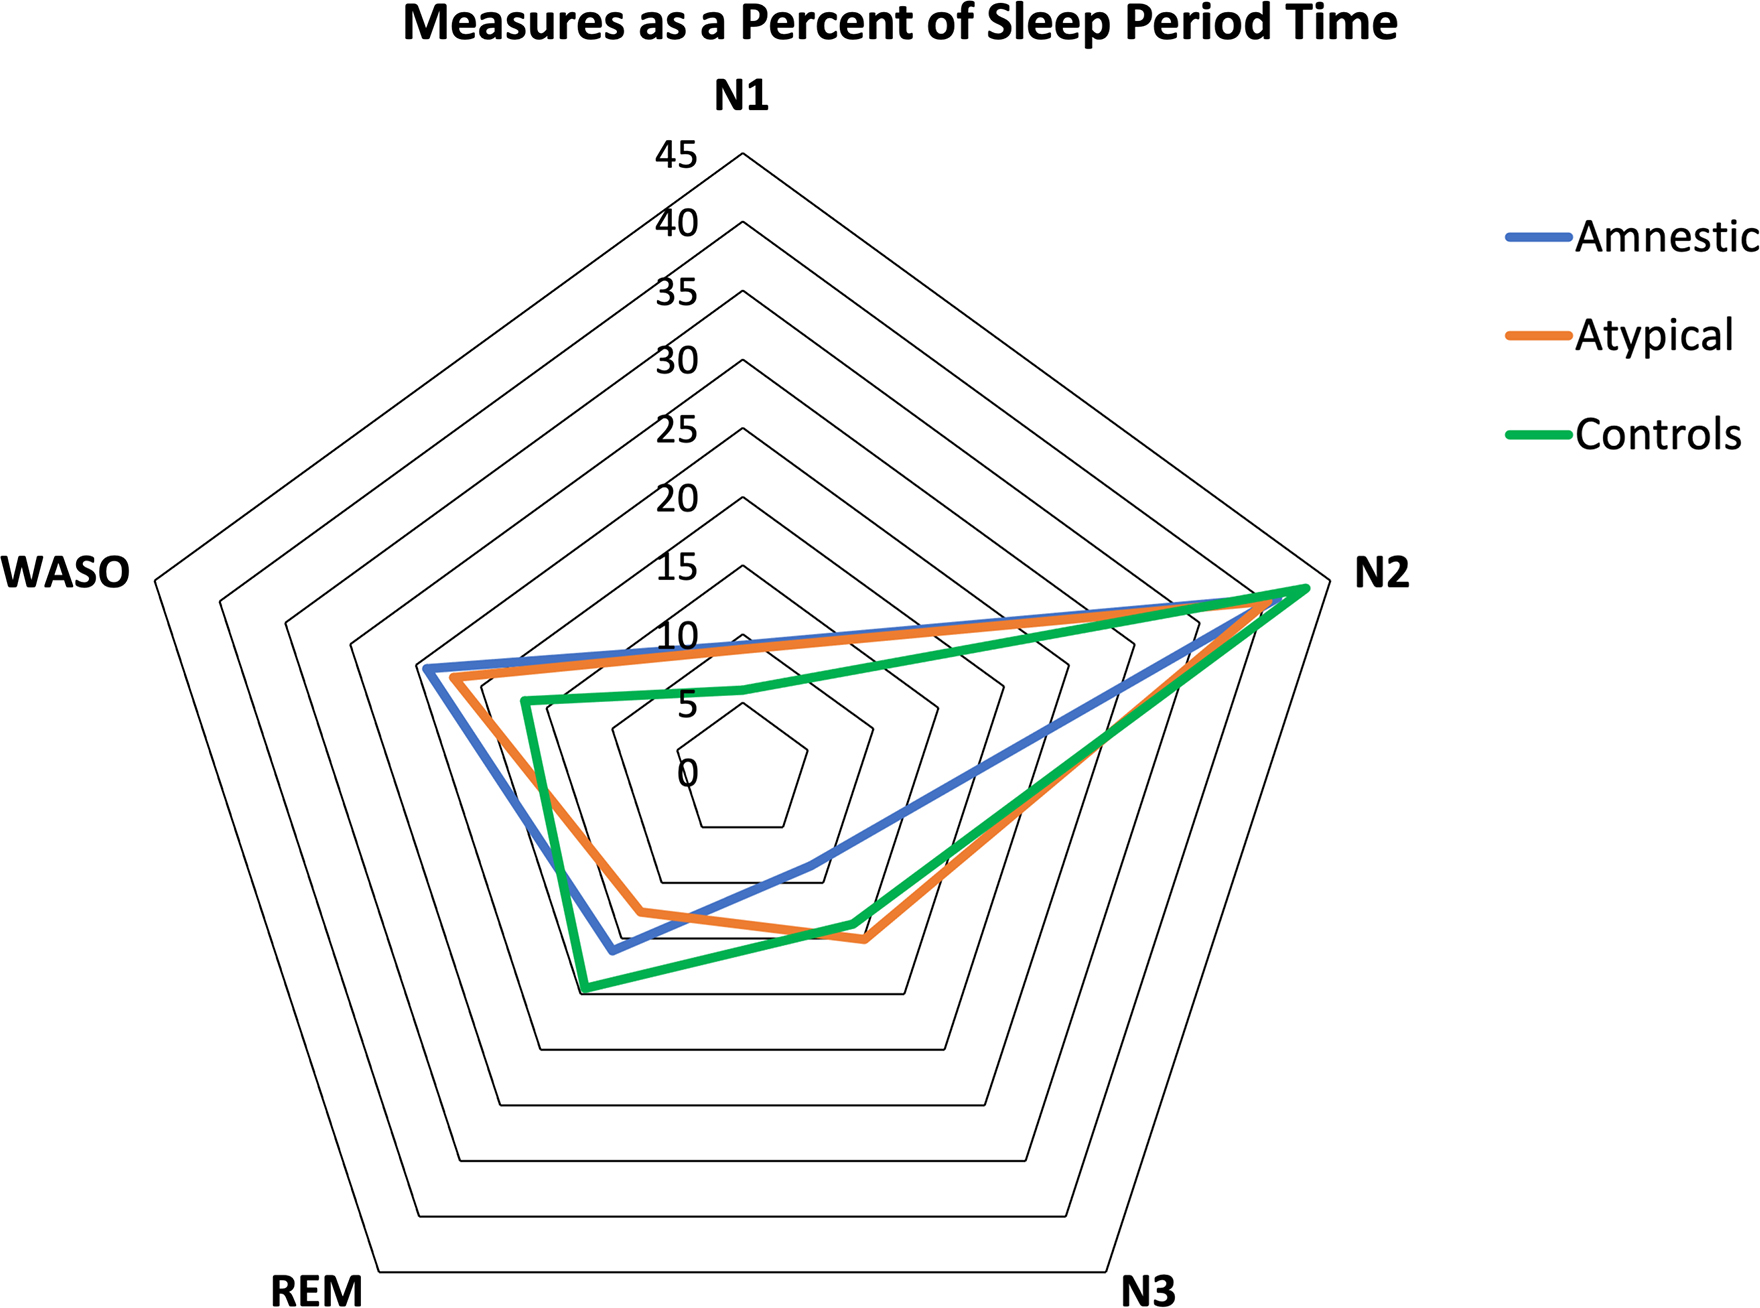
Figure 1.

Distribution of sleep stages over sleep period time (SPT) in amnestic, atypical Alzheimer’s Disease and controls. Fig. 1 Shows the amount of each sleep stage (percentages, %) across groups. Note that the percentage of N3 is reduced in amnestics and REM sleep is reduced in atypical Alzheimer’s Disease. WASO and N1 are increased in Alzheimer’s Disease groups.
