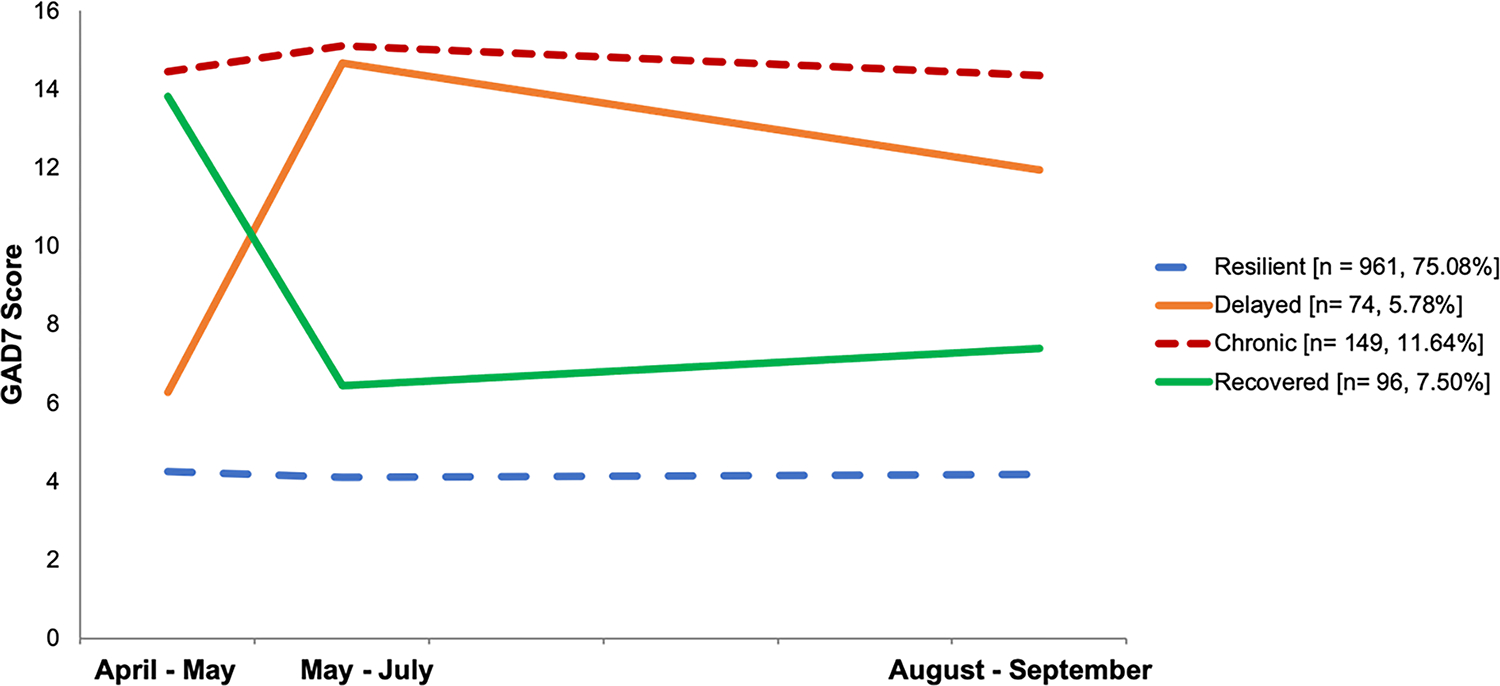
Figure 1.

Mean Anxiety Scores Across the Study Period for the Four Anxiety Trajectory Groups
Note. Anxiety was assessed using the GAD-7. Covariates were included on the intercept and slope factors and as predictors of class membership. Covariates included participant age, sex, education (0 = less than a Master’s degree; 1= Master’s degree or higher), income, living alone, and living in the US. All models were run in Mplus version 8. Model results remained unchanged when the sample was restricted to just the US participants.
