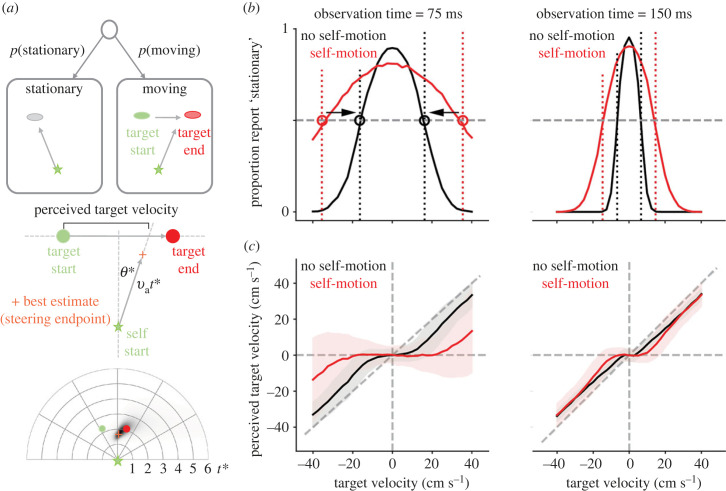
Figure 1.
Predicted behavioural signatures of causal inference when navigating to intercept a briefly observed moving target. (a) Task and trajectories of a normative model. We derived the normative strategy for intercepting a briefly presented target that provided the model with an uncertain estimate of the target velocity and whether the target was moving at all. Top: the model first estimates whether the target is stationary or moving. Middle: we assumed that the model aimed to intercept the target by travelling along a straight line at a certain angle (θ*) and for a certain distance (velocity × duration, vat*). To compensate for the model overshooting or undershooting the target (given uncertainty in path integration, see bottom panel), we assessed the model's perceived velocity by computing when the model's trajectory intercepted the target's path. The middle panel shows a schematized example, while the bottom panel shows an example simulation including the best estimate endpoint (orange) and full posterior (shades of black). (b) Stationary reports. The model perceived the target as stationary if its noisy velocity estimate fell below a velocity threshold (dotted vertical lines). Noise in the velocity estimates resulted in a bell-shaped fraction of stationary reports when plotted over the target's true velocities. For a Bayesian decision strategy, and in contrast to simpler heuristics, the velocity thresholds increased for larger observation noise induced by self-motion (red versus black) and for shorter observation times (left versus right). The bell-shaped curves widened accordingly, and the point at which they intersected the 0.5 proportion (grey dashed line) changed. We highlight this threshold change here for the self-motion versus no self-motion case by the circles and associated black arrows. (c) Perceived target velocities. Causal inference causes the perceived velocities to be biased toward zero for small target velocities, and to approach true target velocities (down-weighted by the slow-velocity prior) for larger target velocities. This bias increases for larger observation noise (red versus black) and shorter observation periods (left versus right). (b,c) Mean (lines) and s.d. (shaded area, (c) only) across 1000 simulated trajectories for each target velocity, ranging from −40 to 40 cm s−1 in steps of 2.5 cm s−1.

