
FIGURE 1.
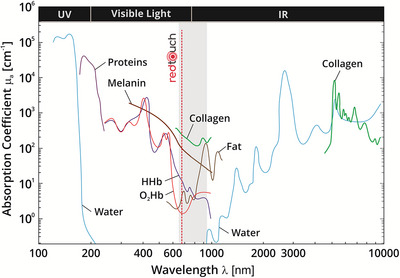
Absorption spectra (logarithm base) for different chromophores present in human tissue. The spectra of oxyhaemoglobin (O2Hb), human haemoglobin (HHb), proteins, water, collagen, fat and cytochrome oxidase (CtOx) are shown. It is possible to appreciate the range of action of the RedTouch device. It shows affinity with collagen, melanin and haemoglobin as well. Picture modified from Scholkmann et al. (2014). 19