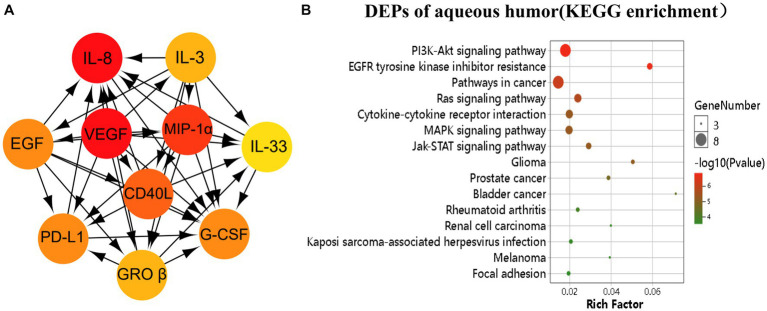
Figure 2.
Pathway analysis of the differentially expressed proteins (DEPs). The DEPs were identified as p < 0.05. (A) The image showed the top 10 highest degree of aqueous connection DEPs from Cytohubba. Arrows indicate the direction of protein–protein interaction. The darker the color, the higher degree of connectivity of the nodes. (B) The TOP 15 aqueous DEPs enriched pathways from KEGG analysis.

