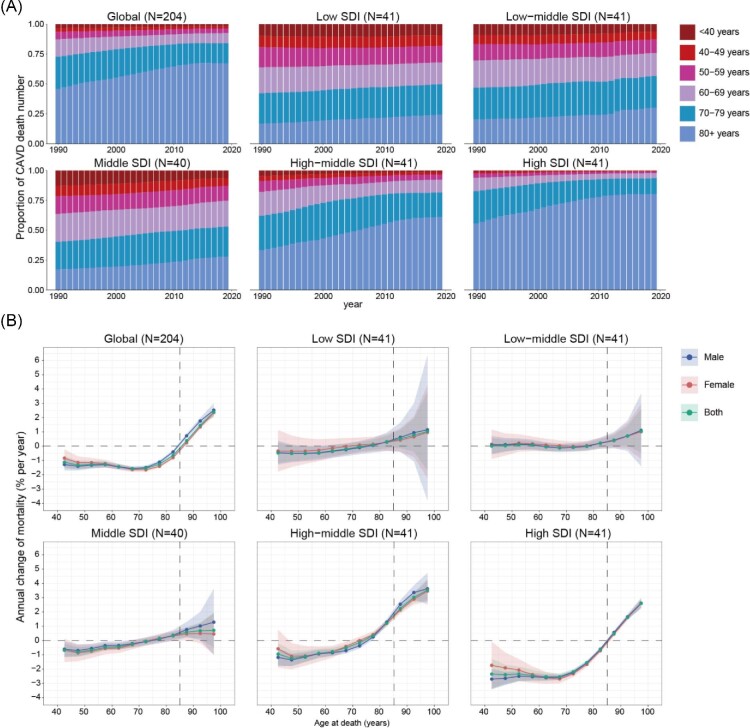
Figure 2.
Age distribution of CAVD deaths and local drift of CAVD mortality by SDI quintiles, 1990−2019. (A) Temporal change in the relative proportion of CAVD deaths across six age groups (<40, 40–49, 50−59, 60−69, 70−79, and ≥80 years), 1990−2019. (B) Age–period–cohort model-derived estimates of local drifts of CAVD mortality for 12 age groups (40−44 to 95−99 years), 1990−2019. The dots indicate the annual percentage change of CAVD mortality (% per year), and the shaded areas indicate the corresponding 95% CIs. CAVD, calcific aortic valve disease; SDI, socio-demographic index; CI, confidence interval.

