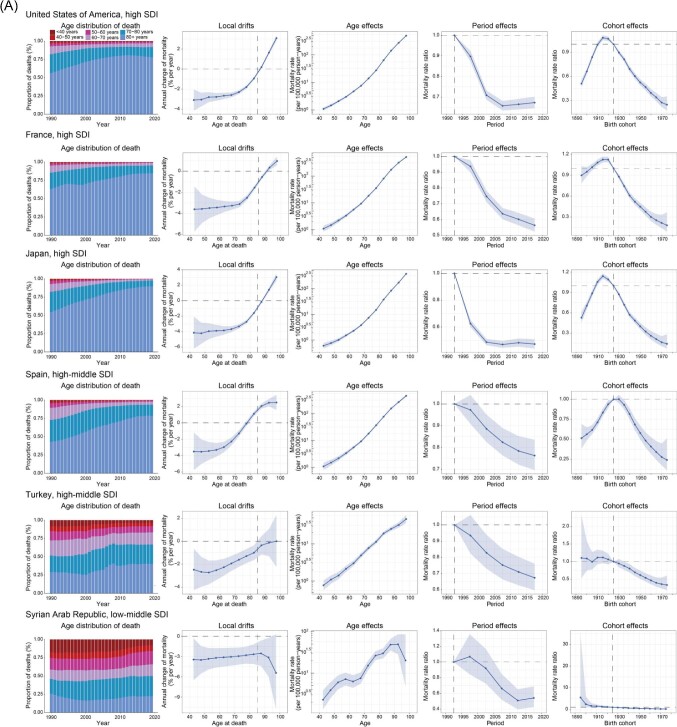
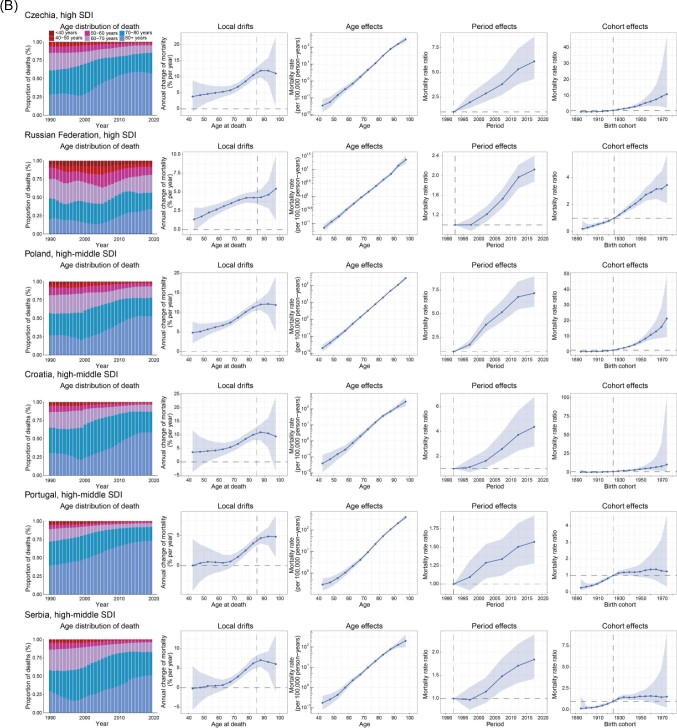
Figure 4.
Exemplar countries across SDI quintiles showing favourable (A) and unfavourable (B) age–period–cohort effects. Age distribution of deaths from 1990 to 2019 shows the relative proportion of CAVD deaths across six age groups (<40, 40–49, 50−59, 60−69, 70−79, and ≥80 years). Local drifts show the fitted longitudinal age curves of CAVD mortality (per 100 000 person-years) across 12 five-year age groups (40−44 to 95−99 years) and the corresponding 95% CIs. Age effects show the fitted longitudinal age curves of CAVD mortality (per 100 000 person-years) and the corresponding 95% CIs. Period effects show the relative risk of mortality of each period compared with the reference (period 1990–1994) adjusted for age and nonlinear cohort effects and the corresponding 95% CI. Cohort effects show the relative risk of mortality of each cohort compared with the reference (cohort 1921–1929) adjusted for age and nonlinear period effects and the corresponding 95% CI. CAVD, calcific aortic valve disease; SDI, socio-demographic index; CI, confidence interval.


