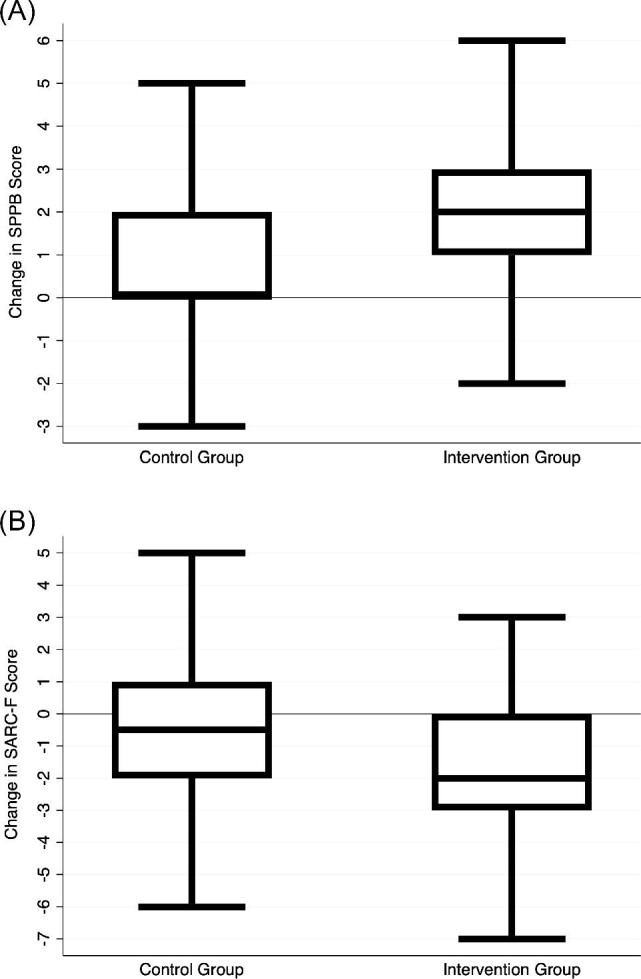
Figure 3.

Change in frailty scores from baseline to follow-up. (A) The top panel depicts the change in SPPB score from baseline to discharge, which was favorable for the intervention group patients. (B) The bottom panel depicts the change in SARC-F score from baseline to 30 days post-discharge, which was favorable for the intervention group patients. SPPB, short physical performance battery.
