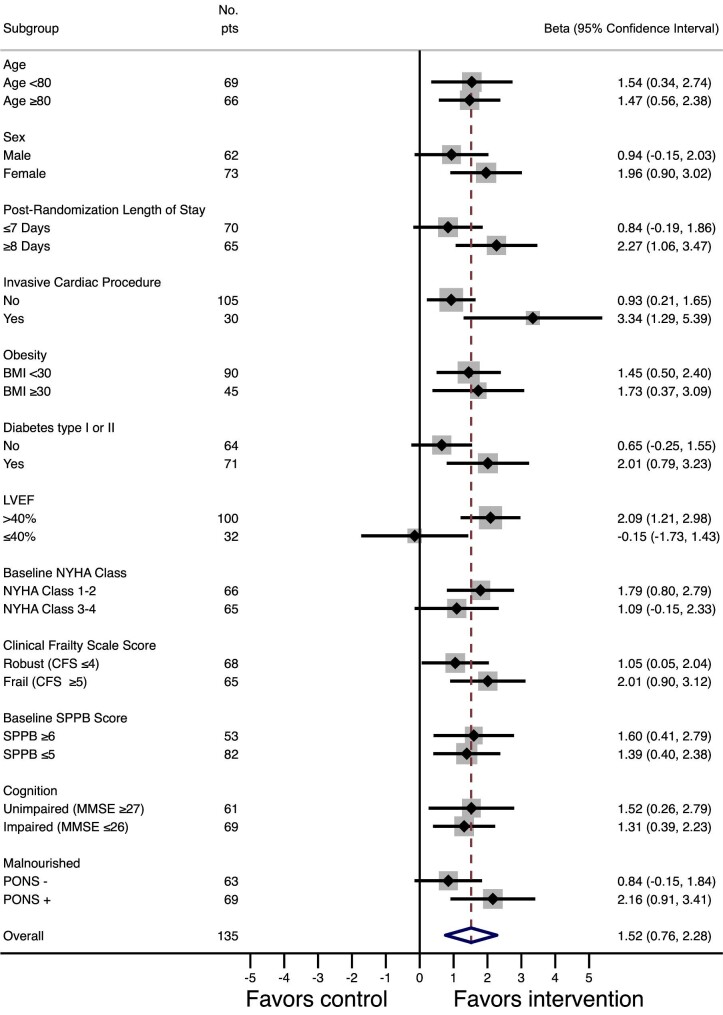
Figure 4.
Effect-modification forest plot. This subgroup analysis forest plot shows the adjusted beta coefficient effect for the intervention stratified by various subgroups of patients. There were two statistically significant interactions: patients who had invasive cardiac procedures derived greater benefits from the intervention, whereas those who had reduced left ventricular ejection fraction derived lesser benefits. There were two other trending interactions: patients who had longer length of stay and thus received a greater volume of intervention visits appeared to derive greater benefits, whereas non-diabetic patients appeared to derive lesser benefits. BMI, body mass index; CFS, clinical frailty score; MMSE, mini mental state examination; NYHA class, New York Heart Association functional classification; PONS, preoperative nutrition score; SPPB, short physical performance batter.

