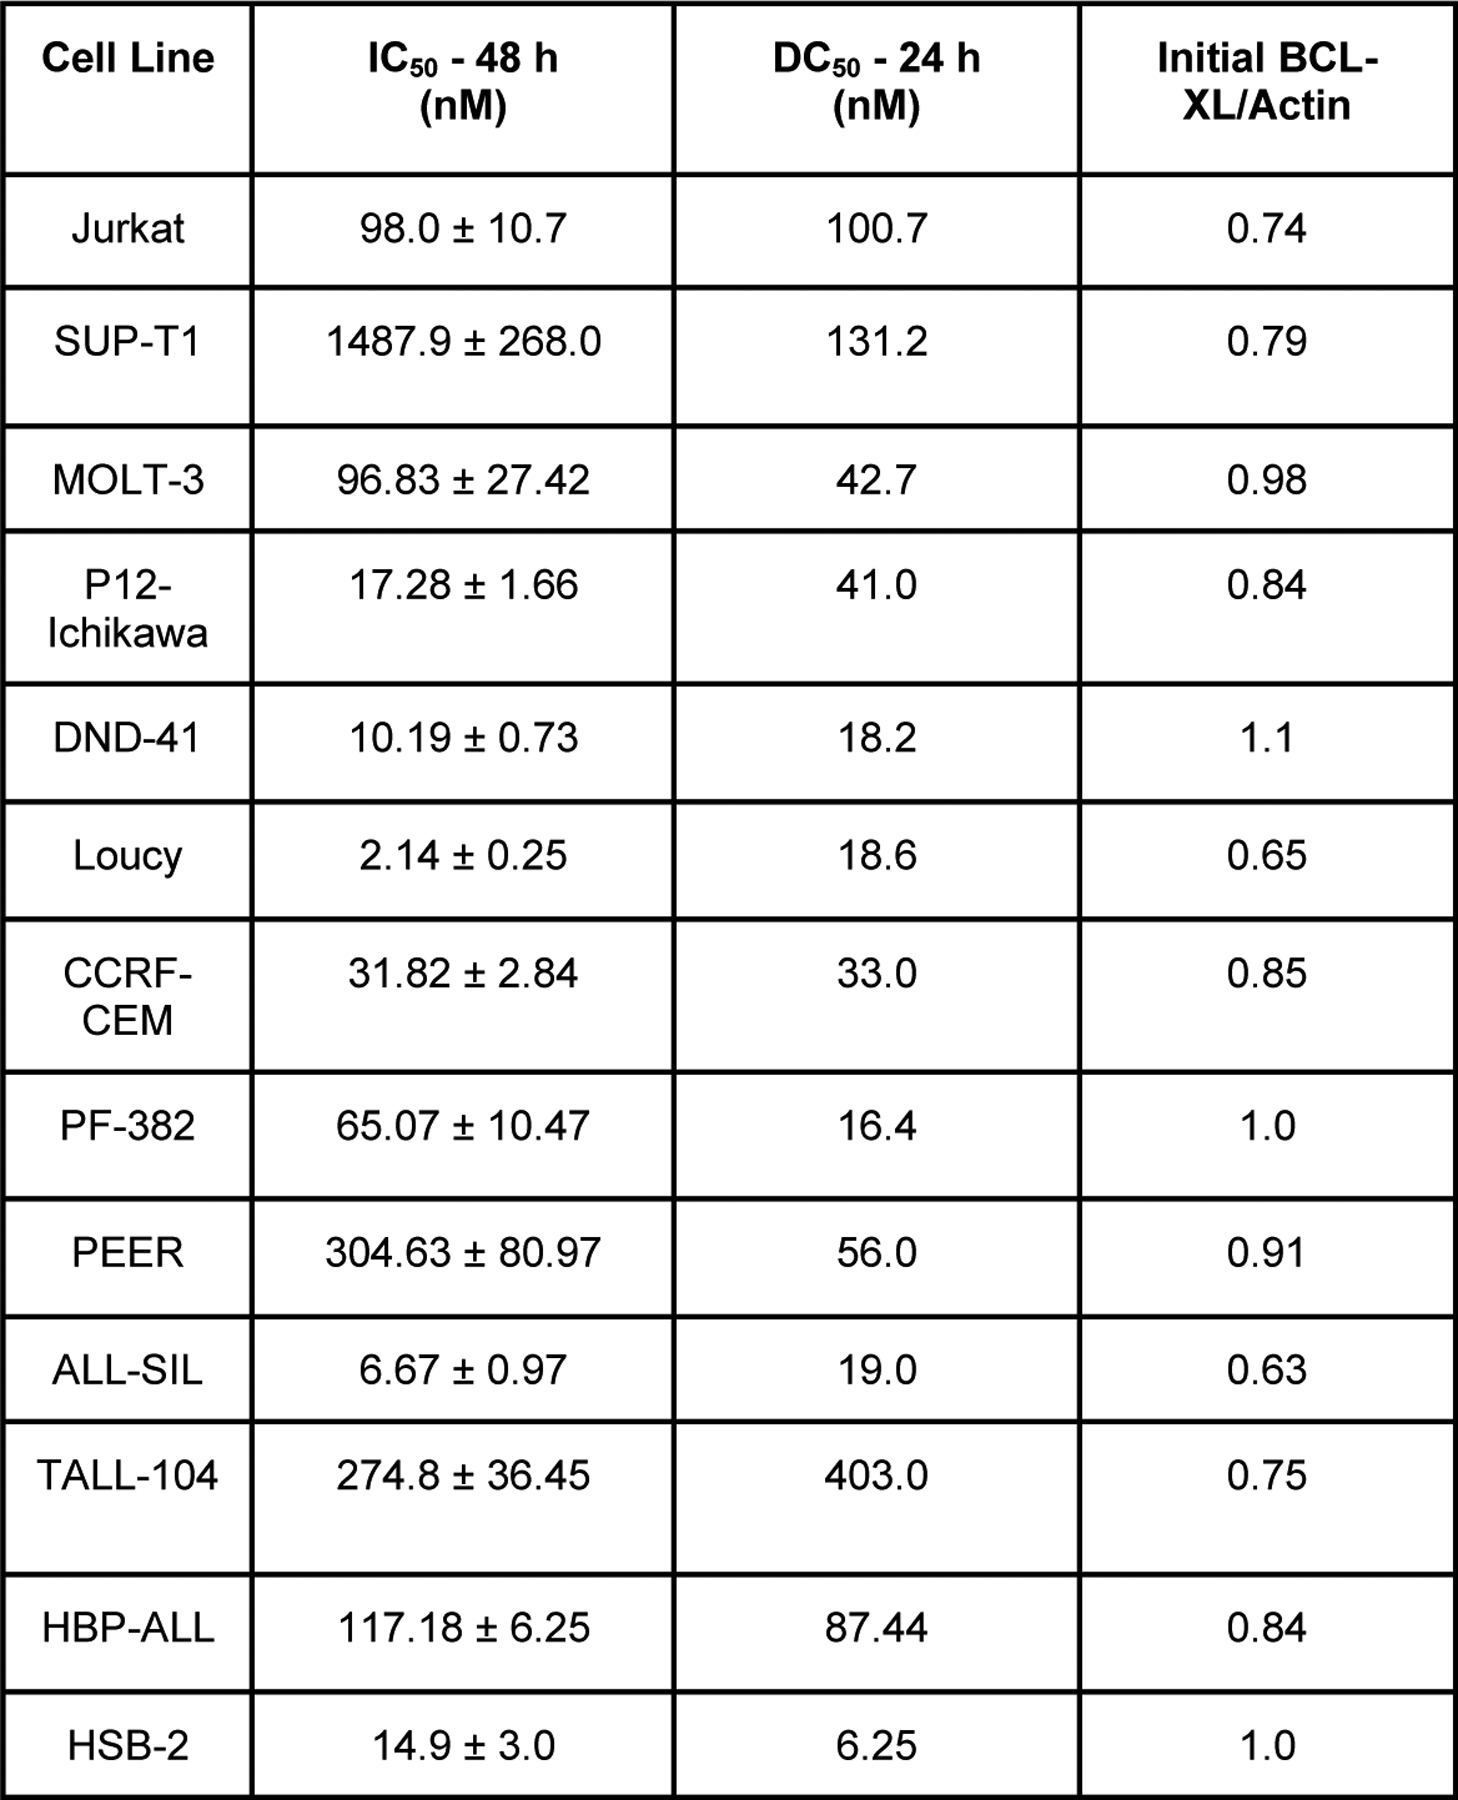
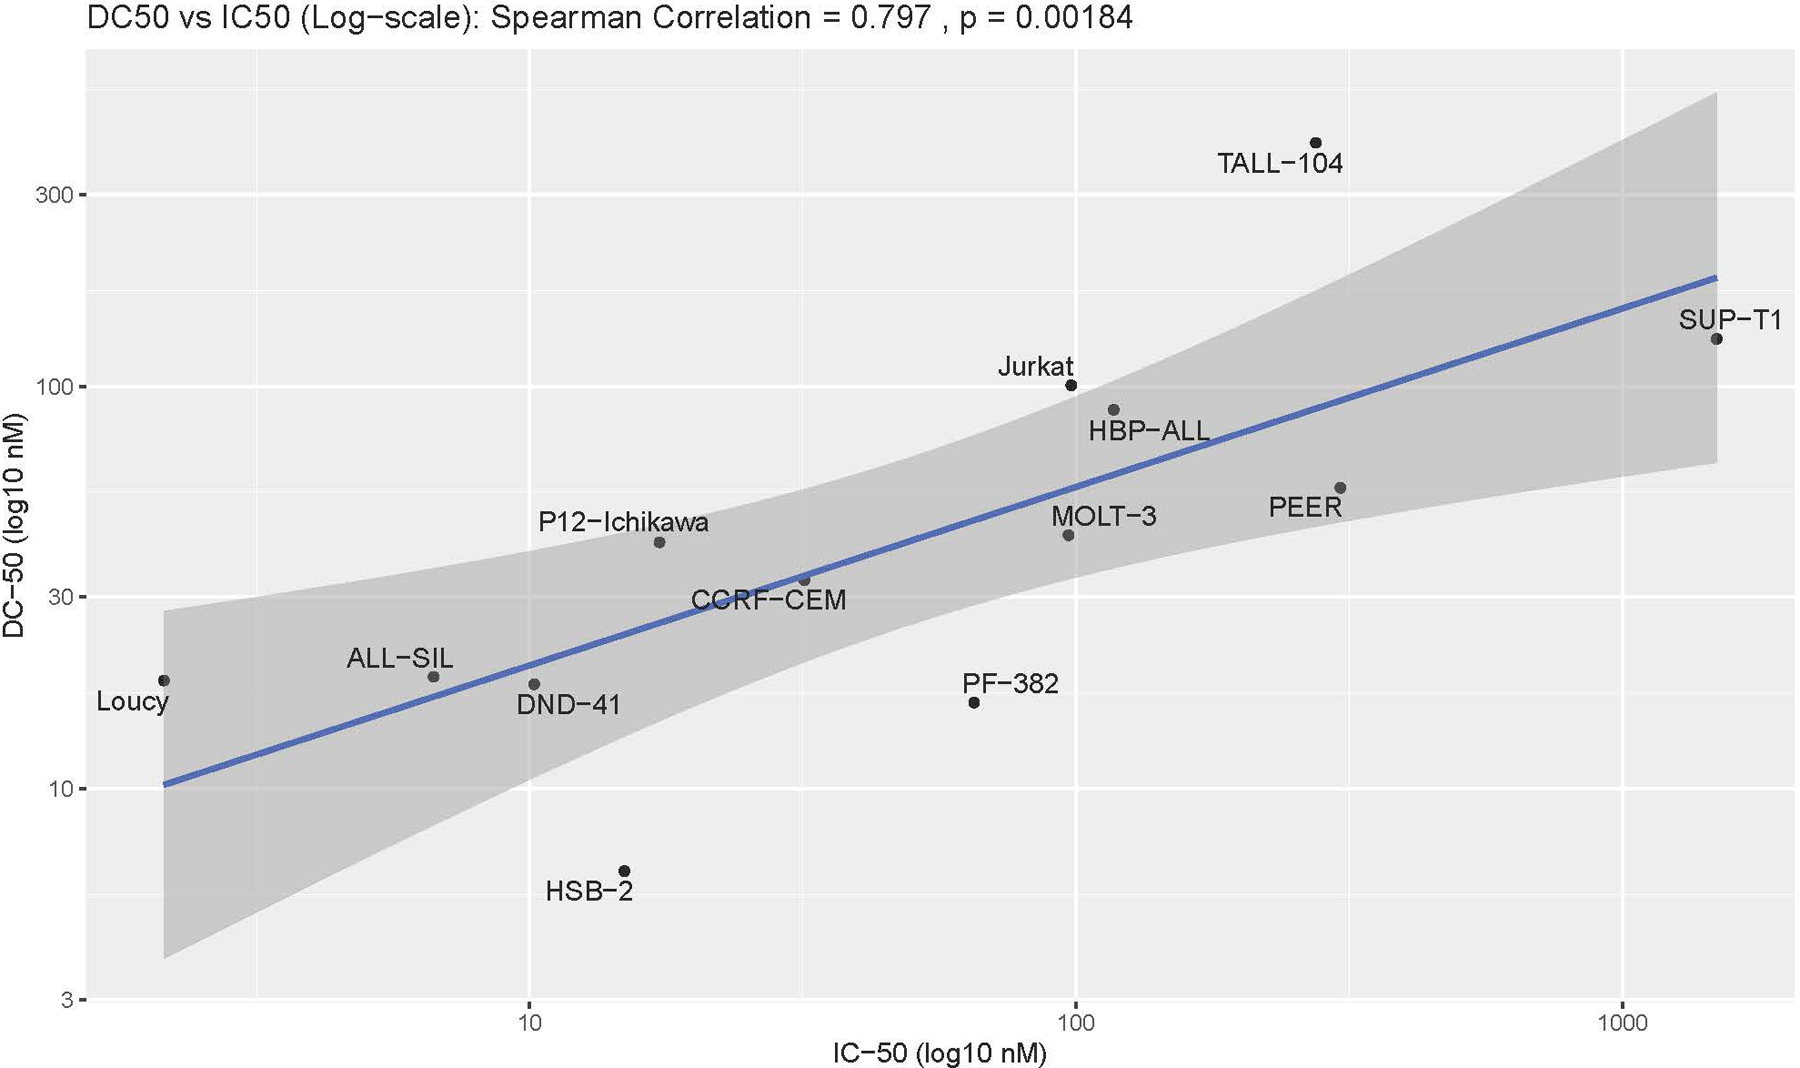
Figure 2. DT2216 concentrations required for cell death and BCL-XL degradation.


A- The left column has the DT2216 inhibitory concentration for 50% of cells (IC50) calculated using MTS assays of the 13 T-ALL cell lines exposed to varying concentrations of DT2216 for 48 hrs. The middle column is the DT2216 concentration for degrading 50% of BCL-XL (DC50) calculated using densitometry on western blots after 24 hrs of DT2216. The right column is the ratio of initial BCL-XL protein levels compared to actin using densitometry of western blot analyses. Full survival curves and western analyses of BCL-XL protein degradation are in the supplemental figures. B- Graphical representation of the Spearman Coefficient correlation between the IC50 and the DC50, P=0.0018.
