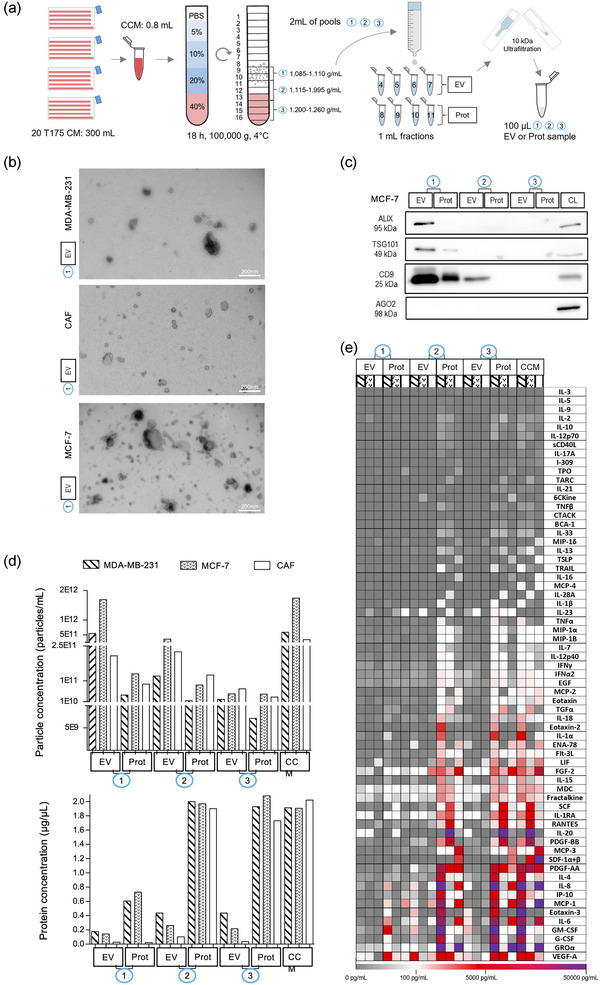
FIGURE 1.

Bottom‐up DG‐SEC efficiently separates EV from soluble cytokines. (a) Schematic representation of the DG‐SEC protocol. CM: conditioned medium, CCM: concentrated CM, EV: EV‐enriched, Prot: protein‐enriched. (b, d, and e) Particle and protein characterization of CCM and pools (p)1, p2 and p3 EV and protein‐enriched samples generated as described in (a) from a representative MDA‐MB‐231, MCF‐7 and CAF harvesting (n = 1) (see Figures S1 c, d,g). (b) Transmission electron microscopy images from MDA‐MB‐231, MCF‐7 or CAF p1 EV‐enriched SEC fractions. Magnification × 30,000, scale bar: 200 nm. (c) Western blot analysis of MCF‐7 p1, p2 and p3 EV and protein‐enriched (Prot) SEC fractions. Thirty microlitres of samples generated by DG‐SEC (a) were denatured as described in the methods section and loaded in each lane. CL: cell lysate (15 μg). (d) Particle and protein concentrations measured in CCM and p1, p2 and p3 EV and Prot samples. Particle and protein concentration were measured by nanoparticle tracking analysis (see (d)) and Qubit protein assay respectively (n = 1). (e) Luminex® cytokine 65‐analytes profiling of CCM and p1, p2 and p3 EV and Prot samples characterized in (b) and (d) (n = 1).
