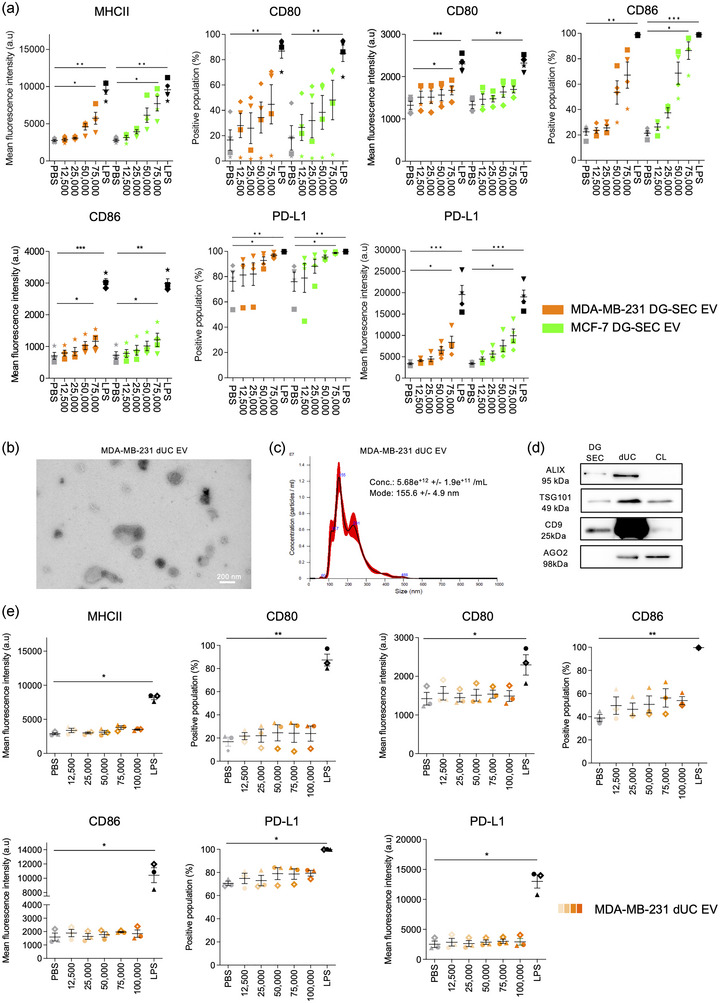
FIGURE 2.

EV separated by DG‐SEC induce a dose‐dependent increase in MoDC maturation markers. a. Flow cytometry analysis after 24 h treatment of 200,000 immature MoDC from healthy volunteers with DG‐SEC EV from MDA‐MB‐231 or MCF‐7 (n = 4 MoDC donors per cell line). Treatment is indicated as corresponding number of NTA‐measured particles per MoDC. LPS (100 ng/mL) was used as a positive control to induce MoDC maturation. PBS was used as a negative control. Data represent mean and standard error. Statistical analysis: Friedman test with Dunn's multiple comparisons test (*p < 0.05, **p < 0.01, ***p < 0.001). (b) Transmission electron microscopy images from MDA‐MB‐231 dUC EV. Magnification x30,000, scale bar: 200 nm. (c) NTA size distribution profile of MDA‐MB‐231 dUC EV represented as mean (black line) and standard error (red shaded area). Conc.: particle concentration. Particle concentration and mode are expressed as mean and standard error (n = 3 videos). (d) Western blot analysis of MDA‐MB‐231 EV DG‐SEC and dUC EV preparations. Thirty microliters of EV preparations were denatured as described in the methods section and loaded in each lane. CL: cell lysate (15 μg). (e) Flow cytometry analysis after 24 h treatment of 200,000 immature MoDC from healthy volunteers with dUC EV from MDA‐MB‐231 (n = 3 MoDC donors). LPS (100 ng/mL) was used as a positive control to induce MoDC maturation. PBS was used as a negative control. Data represent mean and standard error. Statistical analysis: Friedman test with Dunn's multiple comparisons test (*p < 0.05, **p < 0.01, ***p < 0.001).
