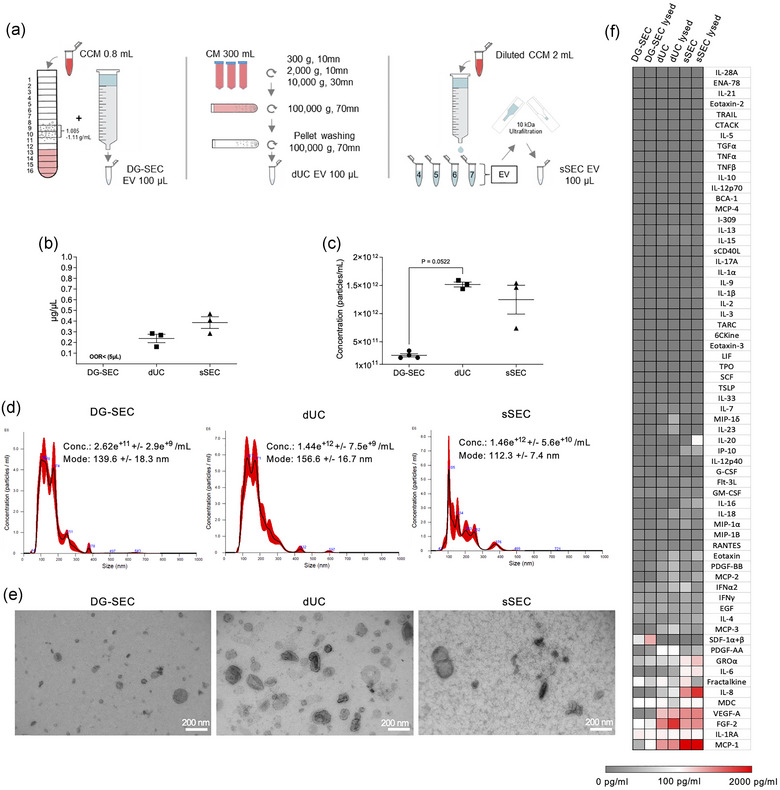
FIGURE 3.

Impact of separation method on breast CAF EV particle and protein content. (a) Schematic view of CAF EV separation using different methods. (b) Protein concentration measured by Qubit using 5 μL of each preparation (DG‐SEC [n = 4], dUC [n = 3], sSEC [n = 3]). (c) Particle concentration measured by NTA in DG‐SEC (n = 4), dUC (n = 3), sSEC (n = 3). Three videos of 30 s were acquired for each replicate. (b–d) Data represent mean and standard error. Statistical analysis: Kruskal Wallis test with Dunn's multiple comparisons test. (d) Representative NTA size distribution profile of DG‐SEC, dUC and sSEC EV represented as mean (black line) and standard error (red shaded area). Conc.: particle concentration. Particle concentration and mode are expressed as mean and standard error. (e) Transmission EM of DG‐SEC, dUC, and sSEC CAF EV, magnification × 30,000, scale bar 200 nm. (f) Cytokine profiling in one representative DG‐SEC, dUC and sSEC EV preparation lysed or not with 0.2% Triton X‐100. Signal from PBS 0.2% Triton X100 control was subtracted.
