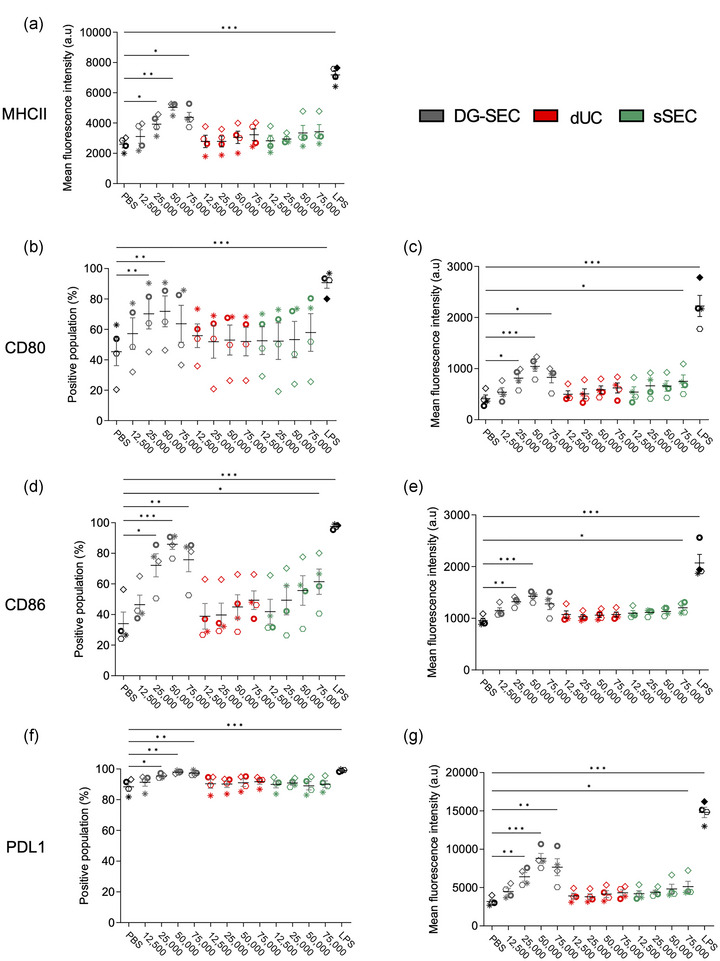
FIGURE 4.

Impact of separation method on CAF EV potential to stimulate MoDC maturation markers expression. (a–g) Flow cytometry analysis after 24 h treatment of 200,000 immature MoDC from healthy volunteers with DG‐SEC, dUC or sSEC EV breast CAF (n = 4 MoDC donors). Treatment is indicated as corresponding number of NTA‐measured particles per MoDC. LPS (100 ng/mL) was used as a positive control to induce MoDC maturation. PBS was used as a negative control. Data represent mean and standard error. Statistical analysis: Friedman test with Dunn's multiple comparisons test (*p < 0.05, **p < 0.01, ***p < 0.001).
