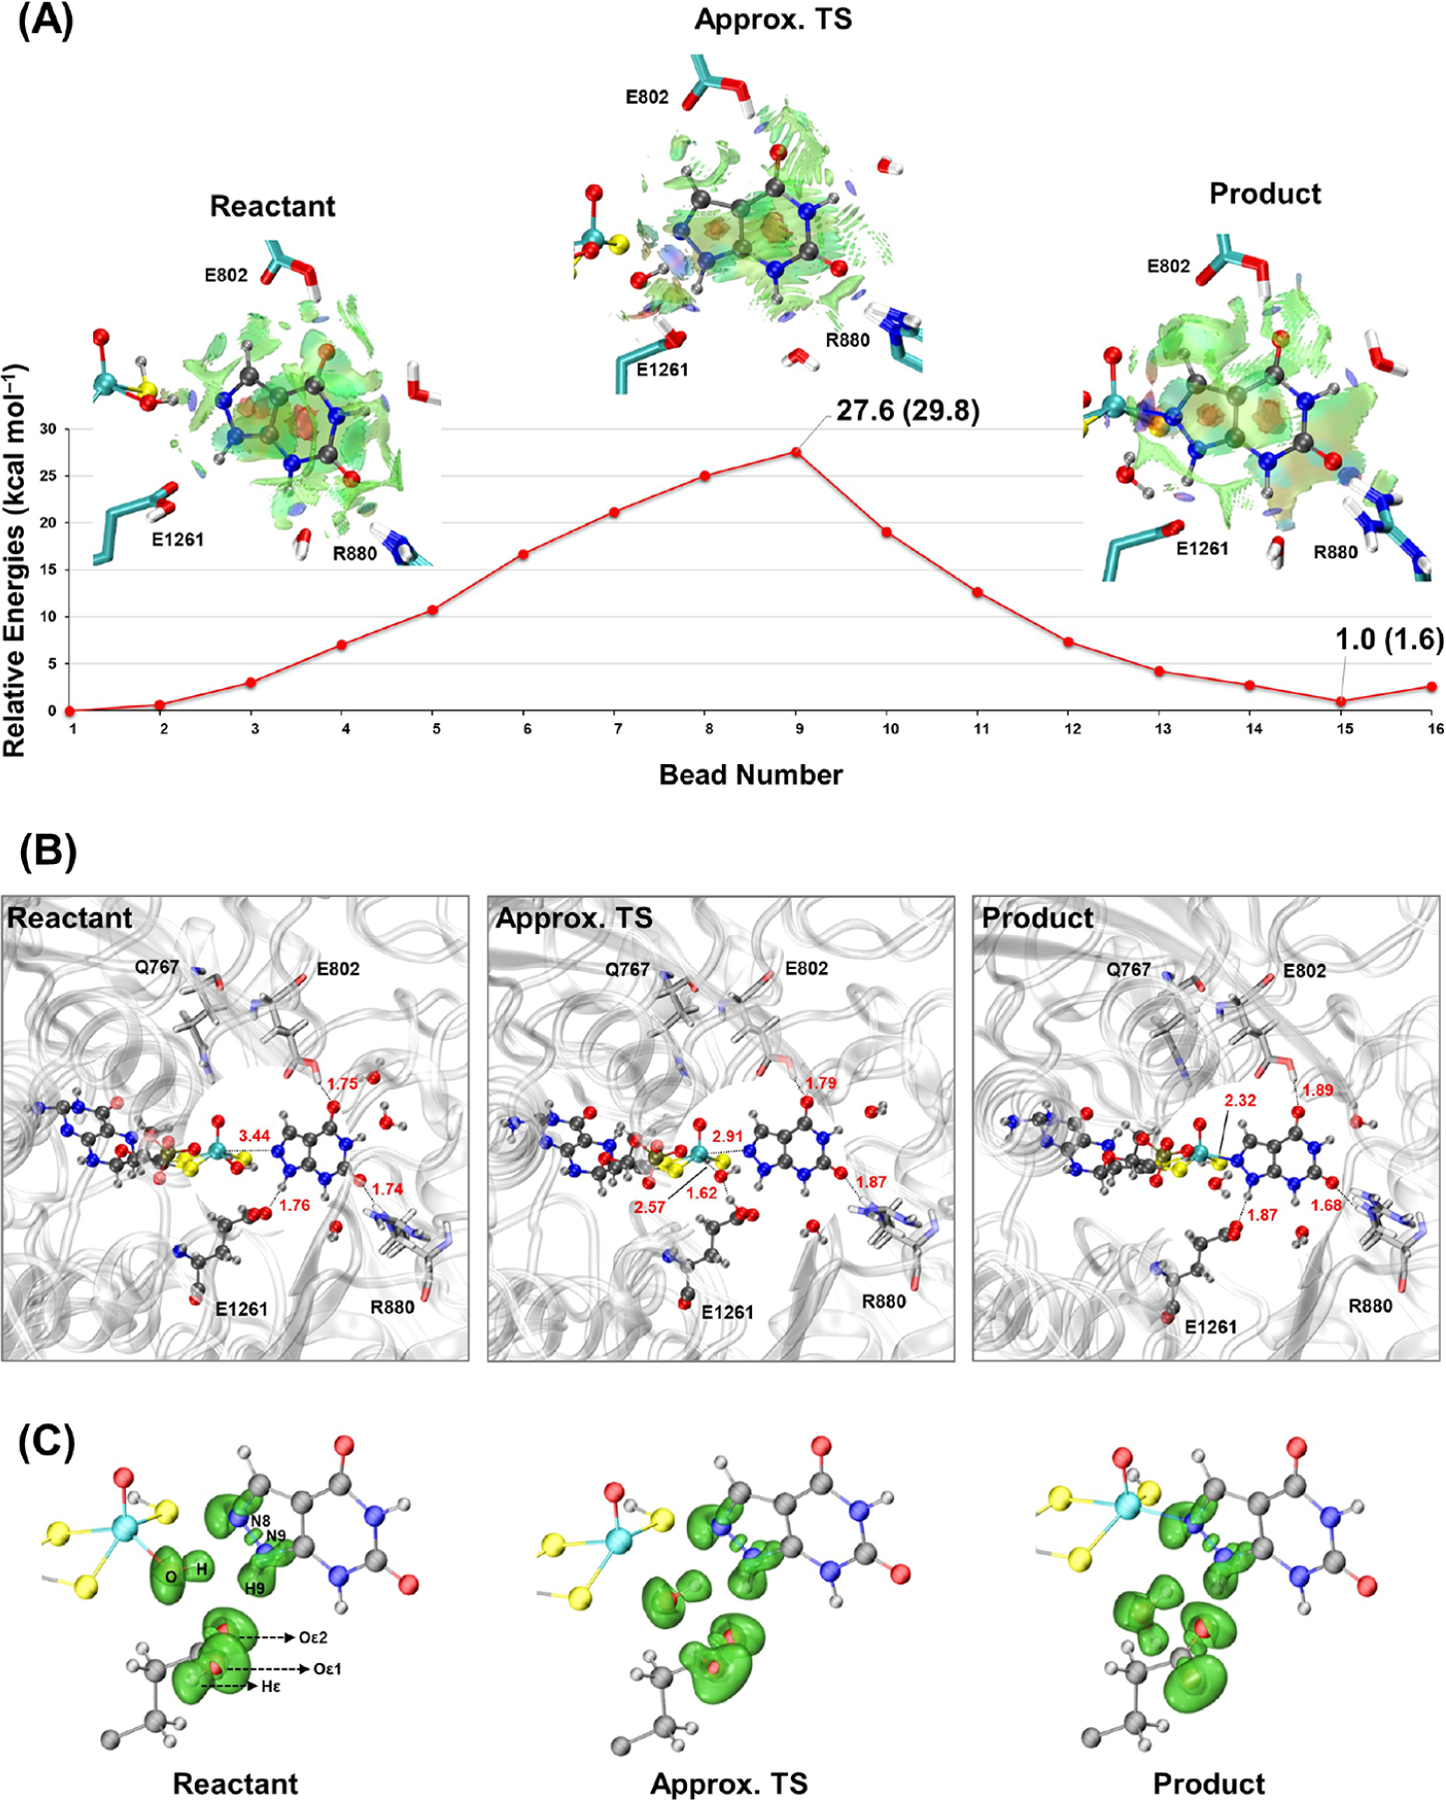
Figure 4.

(A) Minimum energy path for the catalytic inhibition of XO by oxipurinol modeled via the QSM together with the NCI plots of the critical structures. The QM/MM optimization energies (kcal mol−1) are calculated at the B97X-D/def2-SVP level of theory with the AMBER ff14SB force field. The values in parenthesis correspond to the Gibbs free energies obtained from the vibrational analysis using Eyringpy. (B) Optimized geometries of the critical structures with the values of selected distances (Å). (C) ELF basins among the MoCo, oxipurinol, and E1261 for the critical structures along the reaction pathway.
