
Fig. 2.
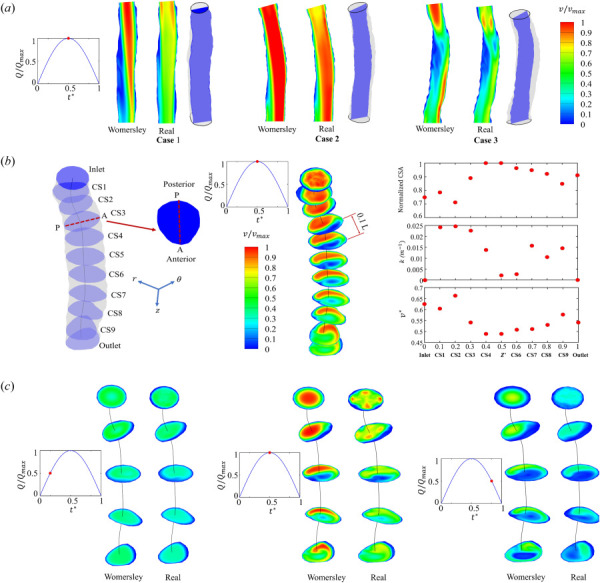
Rapid breathing—velocity distribution subject to Womersley and real inlets revealed on (a) the sagittal plane for three patients and (b) normalized CSA (CSA/Max CSA), local curvature (k = 1/r) where “r” is the local radius of curvature measured from the centerline at each cross section (CSA 1-9) along with the inlet and outlet, represents the normalized average velocity at each cross section (CSA 1-9) obtained at the peak phase (t* = 0.5), and (c) velocity contours in case 3 for time; t* = 0.17, 0.5, and 0.83, respectively