
Figure 2.
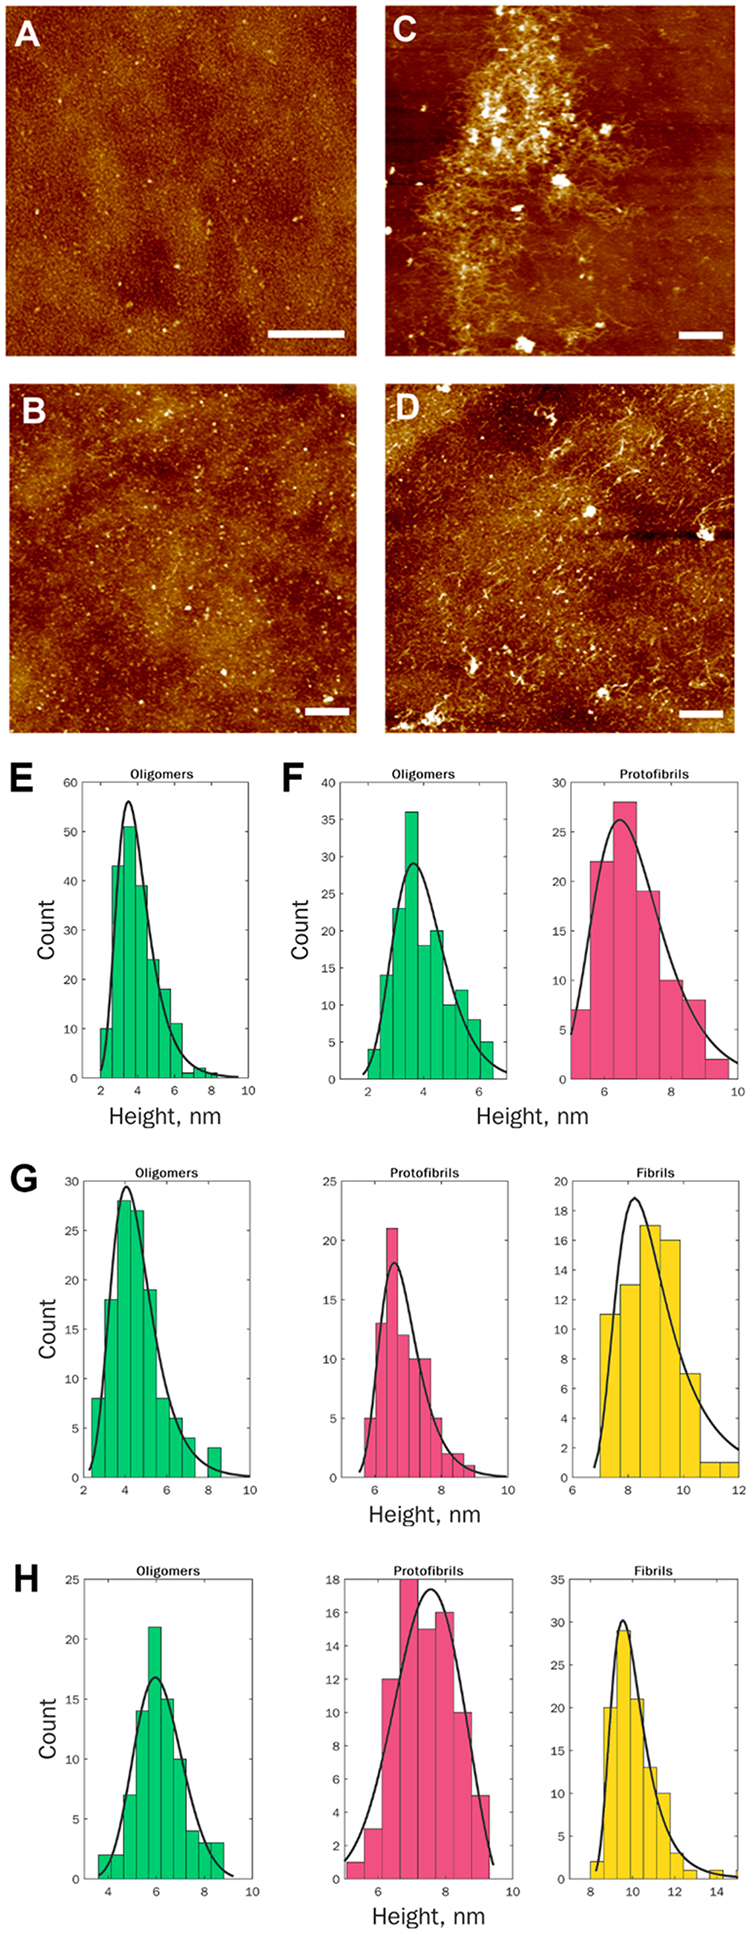
Morphological examination of Aβ1–42 aggregates observed at different states of protein aggregation. AFM images (A–D) and height profiles (E–H) of protein aggregates observed at 4 h (A and E), 24 h (B and F), 72 h (C and G) ,and 168 h (D and H) after the initiation of Aβ1–42 aggregation. Scale bars are 1 μm (A) and 2 μm (B–D).