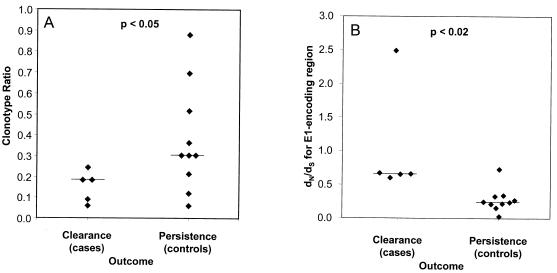
FIG. 4.
Virologic correlates of outcome. (A) Clonotype ratio, calculated as the ratio of the number of clonotypes detected to the number of cloned DNAs examined (Table 2), versus outcome. (B) E1 dN/dS ratio versus outcome. For each subject, all pairwise nonsynonymous and synonymous distances were calculated for the E1-coding region. These distances were averaged, and the dN/dS ratio was then calculated. Horizontal lines represent medians.

