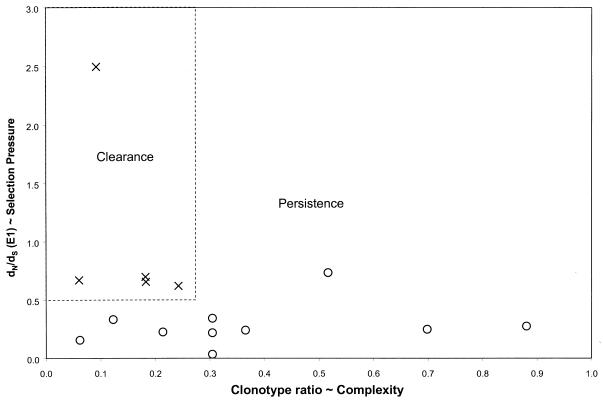
FIG. 6.
Ratio of nonsynonymous to synonymous distances versus clonotype ratio. Values from Fig. 4A and B were plotted on the same graph, and a box (dotted line) is drawn around the points representing values for the case subjects (with clearance of viremia).

