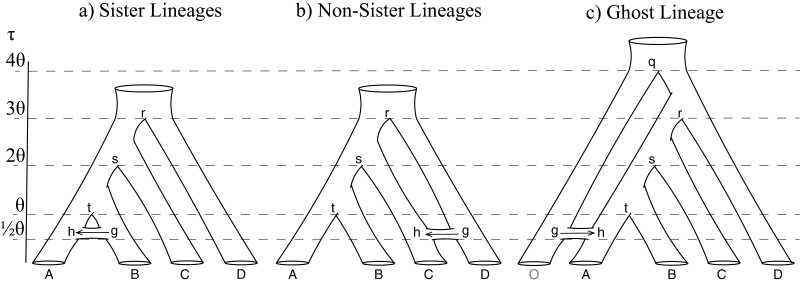
Figure 1.
Species networks used for simulations. a) Gene flow between sister lineages: species A and B diverged at time τt, and introgression occurred from B into A at time τh. b) Gene flow between non-sister lineages (from species D into C at time τh. c) Gene flow from an unsampled ghost lineage O (shown in gray) into species A. Divergence time is given in units of population size . Population size is constant among all branches. Node names are shown with lower-case letters. The direction of introgression is from node g to h, indicated by the arrow. Simulations under the IM model use the same species trees, but with migration occurring after species divergence at the constant rate of M = Nm migrants per generation.

