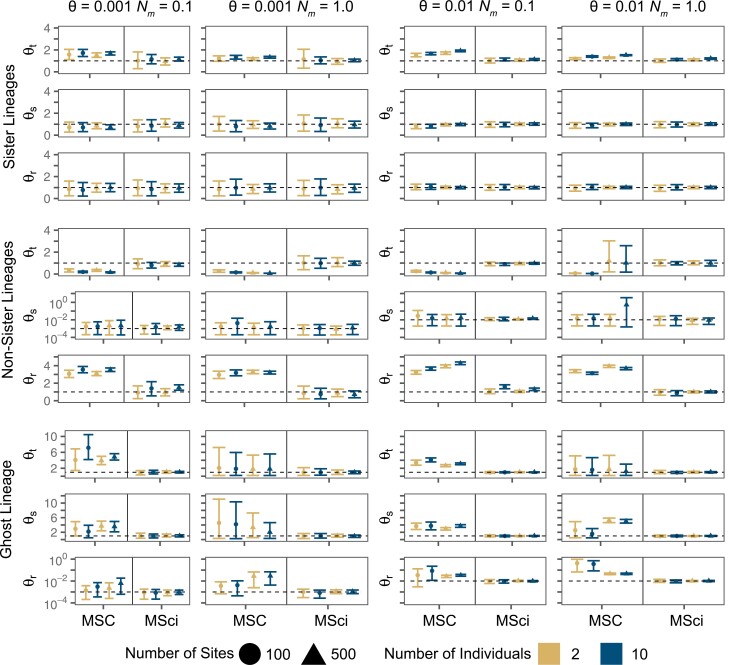
Figure 5.
Population size estimates for speciation nodes simulated under the IM model. True values are shown with a dashed horizontal line. Points are posterior means and error bars are 95% HPD CIs, averaged over 10 replicates. for the non-sister scenario and for the ghost lineage scenario are shown on the log10 scale. The y-axis scale is for when and , respectively.

