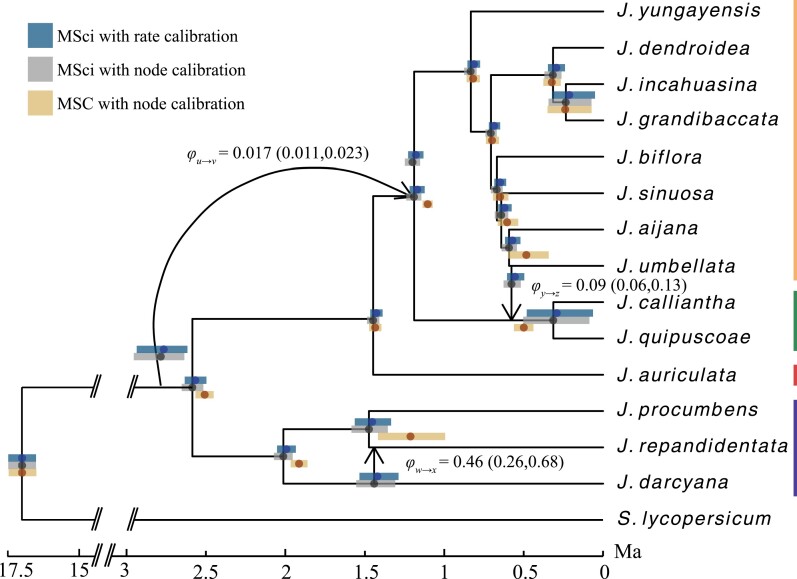
Figure 7.
Divergence time estimates for Jaltomata. node heights are posterior means under the MSci with node-calibrated divergence times. Reticulate edges are shown by black arrows along with their corresponding introgression probabilities from the MSci model. Posterior means and 95% HPD CIs for the ghost introgression donor and recipient nodes are shown above their vertices to improve visibility. Vertical bars along the right show fruit colors among lineages.

