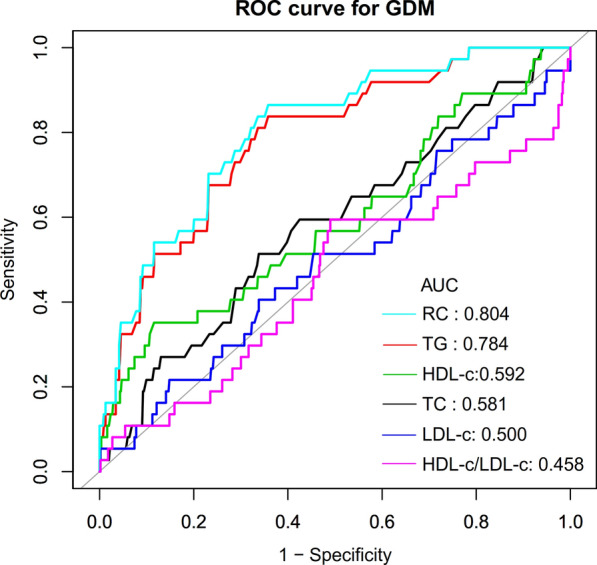
Fig. 3.

The results of ROC curve analysis for measuring the ability of RC, HDL-c, LDL-c, TG, HLR, and TC to predict the risk of GDM. Showed that RC was a better predictor of GDM in pregnant women than other lipid parameters. ROC curve analysis showed that the area under the curve for HLR, LDI-c, TC, HDL-c, TG, and RC were 0.4585, 0.5000, 0.5810, 0.5923, 0.7837, and 0.8038, respectively
