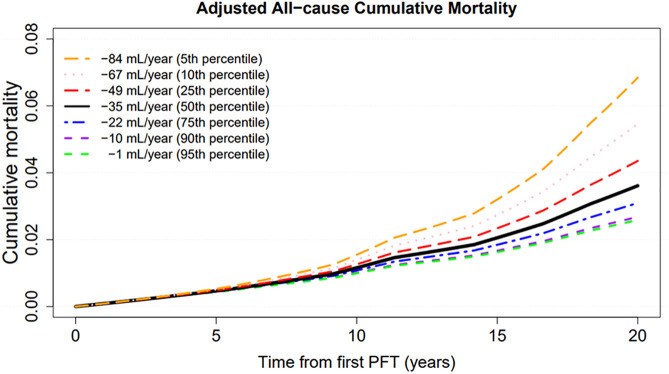
Figure 2.
Results from joint longitudinal survival models for World Trade Center (WTC)–exposed Fire Department of New York responders evaluating lung function decline and all-cause mortality. Seven curves correspond with results from cumulative mortality plots for individuals whose forced expiratory volume in 1 second decreased at the 5th (orange), 10th (pink), 25th (red), 50th (black), 75th (blue), 90th (purple), and 95th (green) percentiles. The model controls for age on September 11, 2001 (centered at 40 yr), race (centered at White), smoking (centered at never), work assignment on September 11, 2001 (centered at firefighters), height (centered at 180 cm), and WTC arrival time (centered at initial arrival between September 13, 2001, and July 25, 2002). PFT = pulmonary function test (spirometry).

