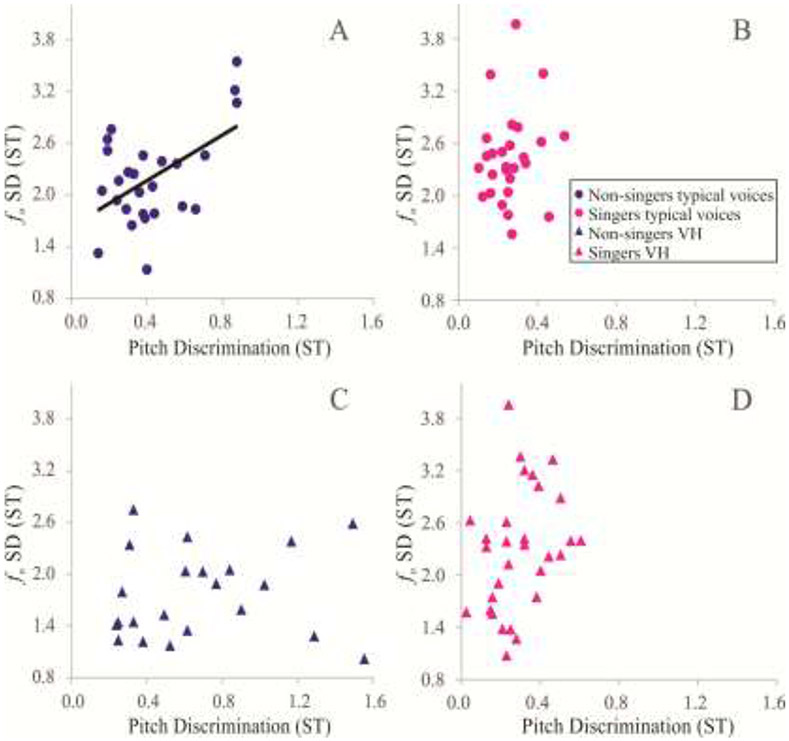
Figure 2.
Scatter plots of participant values of fundamental frequency (fo) standard deviation (SD) in semitones (ST) and pitch discrimination in ST for (A) Non-singers with typical voices, (B) Singers with typical voices, (C) Non-singers with vocal hyperfunction (VH), and (D) Singers with VH. A line of best fit is shown for the statistically significant correlation. Data from non-singers are presented in circles and singers are presented in triangles. Data from individuals with typical voices are presented in dark blue, and individuals with VH are presented in light pink.

