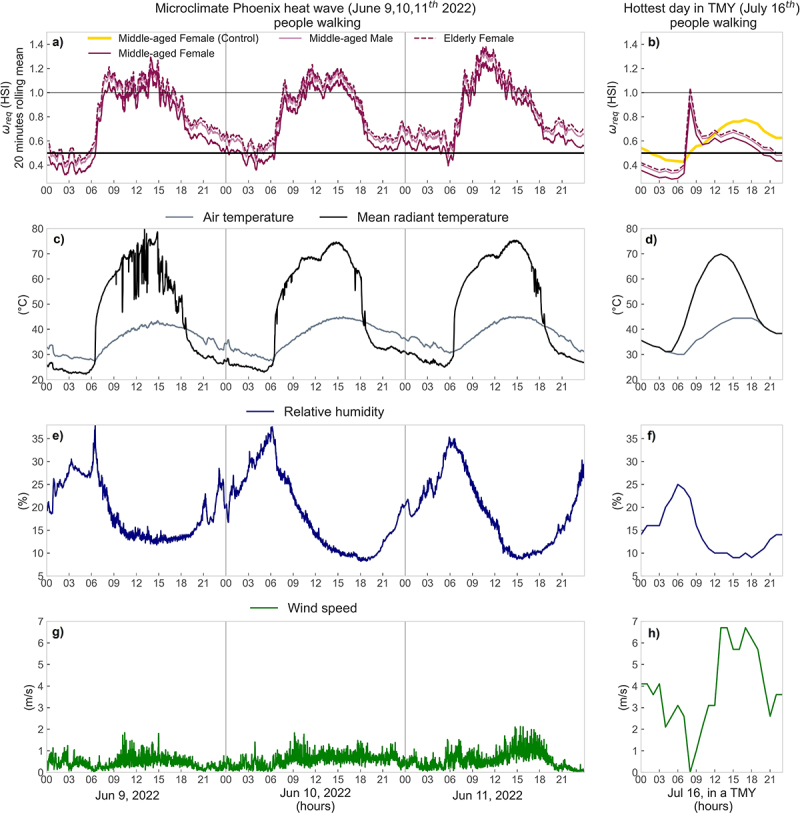
Figure 10.

Case 5 – From top to bottom: (a,b) modeled (or HSI) for the three personal profiles (Middle-aged Female/Male andElderly female, all assumed to be walking); (c, d) air temperature and mean radiant temperature; (e, f) relative humidity; and (g, h) wind speed. The left panel corresponds to 1-minute microclimate data during a June 9–11th, 2022 heatwave in Phoenix, AZ, and the right panel to the hourly data for the hottest day in the TMY in Phoenix, AZ (July 16th). Graph a represent as 20-minute rolling means. In (a, b), the horizontal lines delimit: 0.5 and 1, and the yellow line in b) corresponds to the control run (gray line) in Figure 9.
