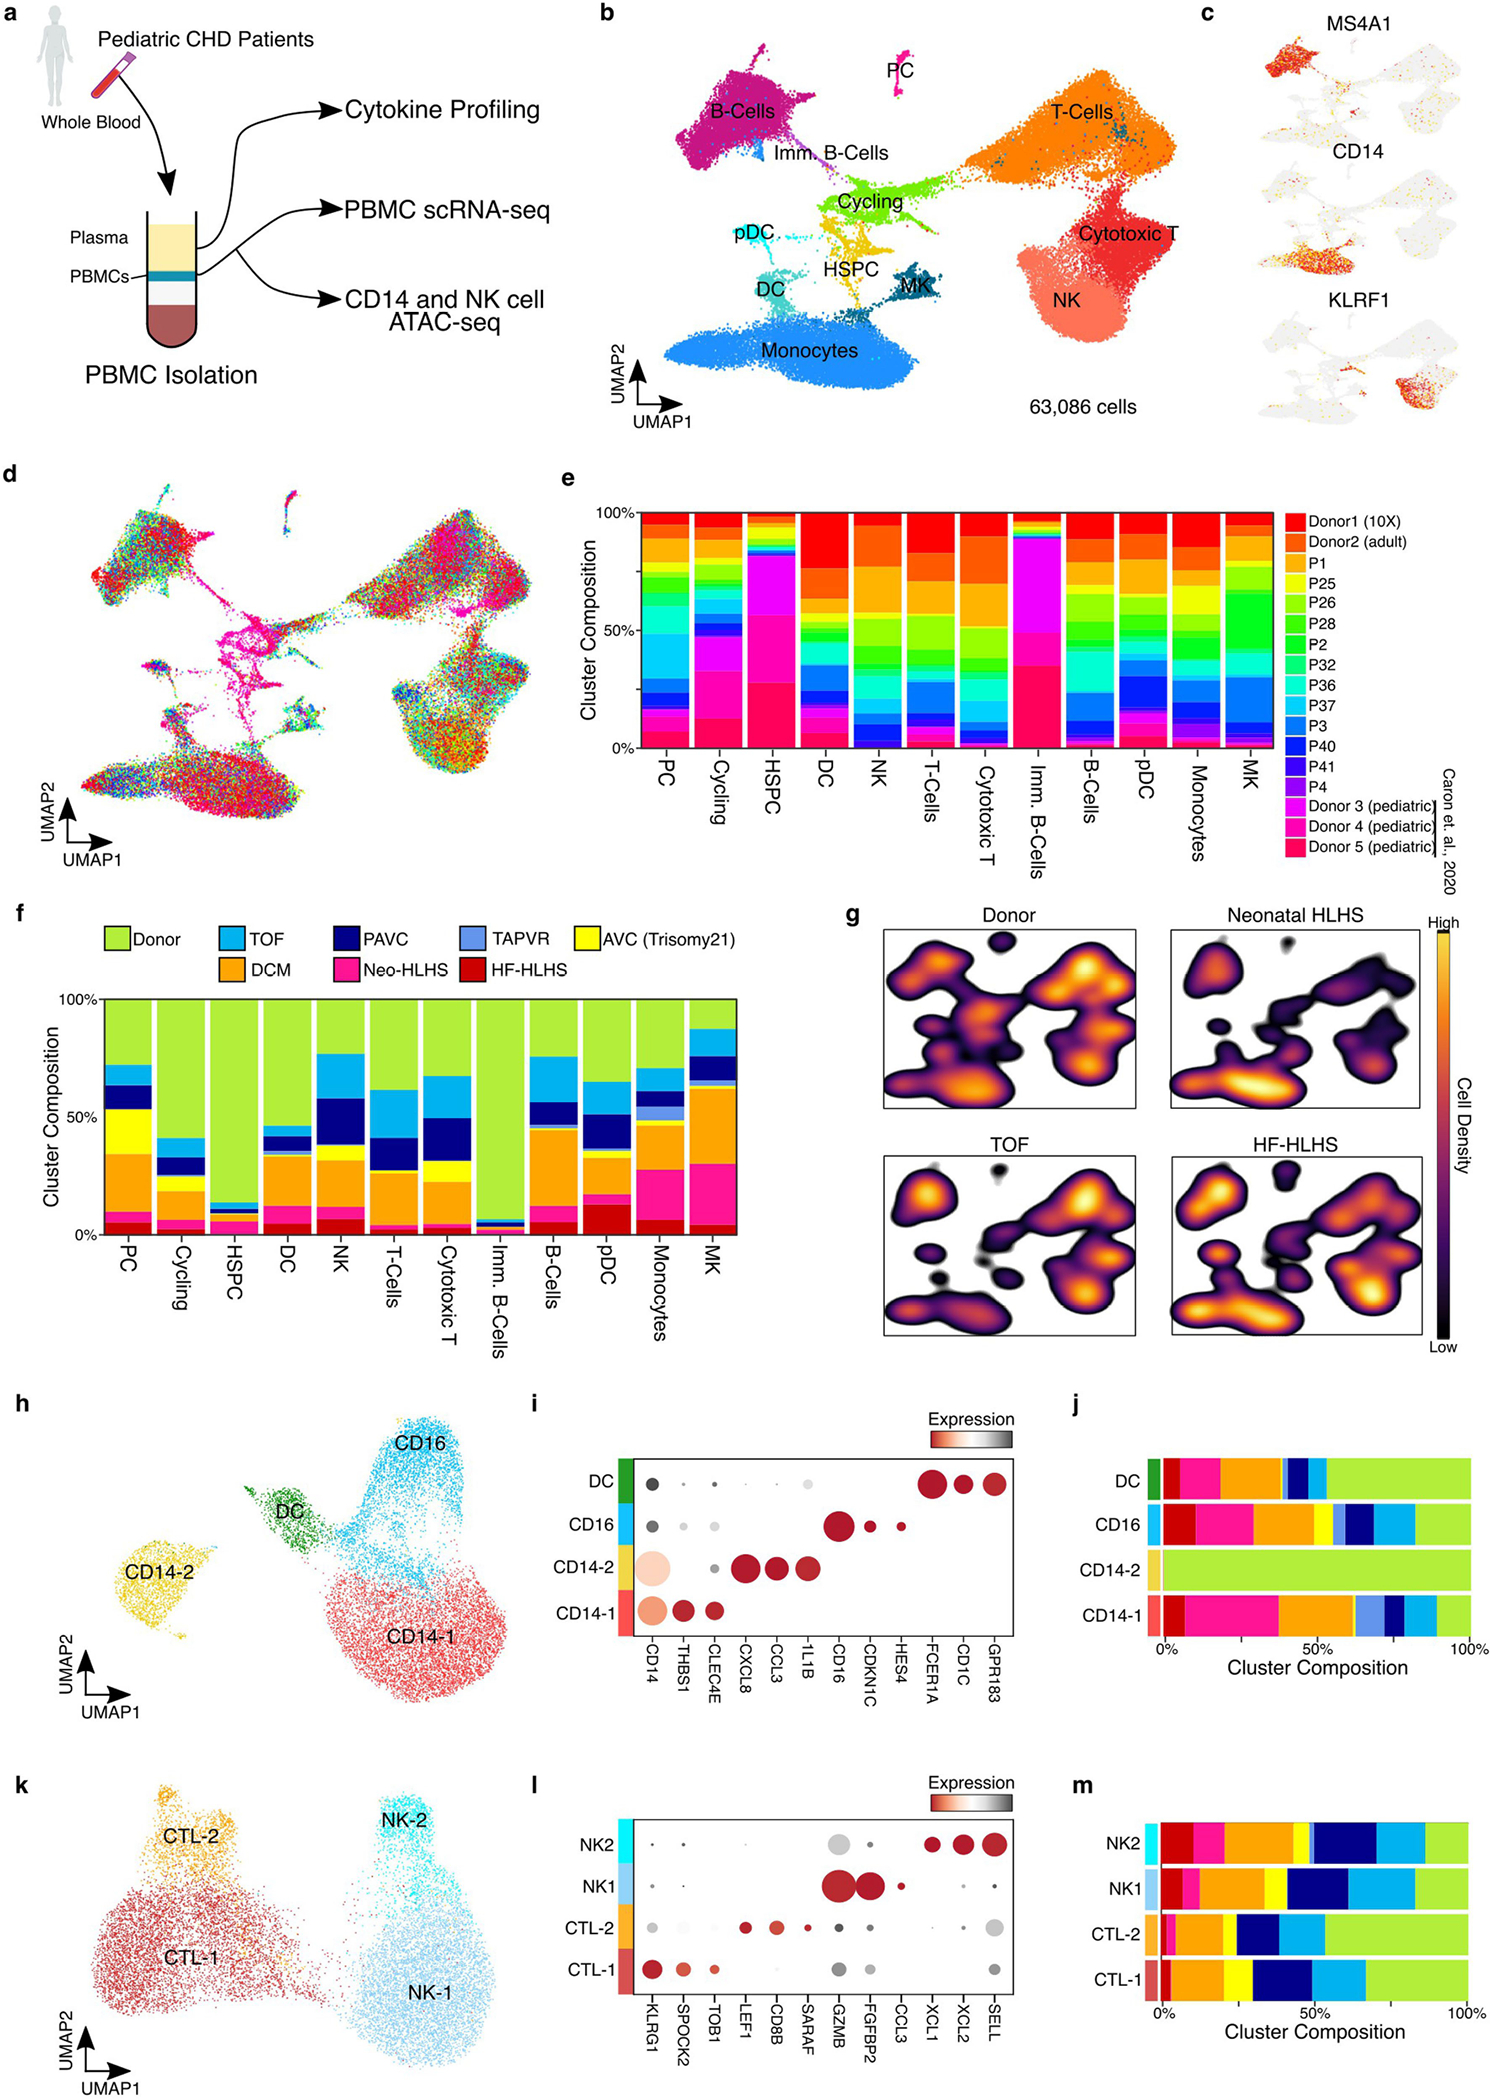
Extended Data Fig. 8 |. Single-cell transcriptomic analysis of PBMCs from pediatric patients with CHD.

a, Diagram depicting the overall study design for hematological profiling in CHD patients. b, UMAP embedding of PBMCs colored by cell type. c, Feature plots showing the expression of marker genes. d, UMAP embedding of PBMC scRNA-seq data colored by patient sample Identification number. e, Cluster composition analysis of PBMC scRNA-seq data. f, Cluster composition stacked-bar plot highlighting the percent of cells from each diagnosis group within each single cell cluster. g, Density plot for each indicated diagnosis over the UMAP embedding from Extended Data Fig. 8b. h, UMAP embedding of peripheral monocyte cells. i, Dot plot displaying marker gene expression from monocyte cell clusters. j, Cluster composition analysis of monocyte clusters colored by patient diagnosis. k, UMAP embedding of peripheral NK cells. l, Dot plot displaying marker gene expression from NK cell clusters. m, Cluster composition analysis of NK cell clusters colored by patient diagnosis.
