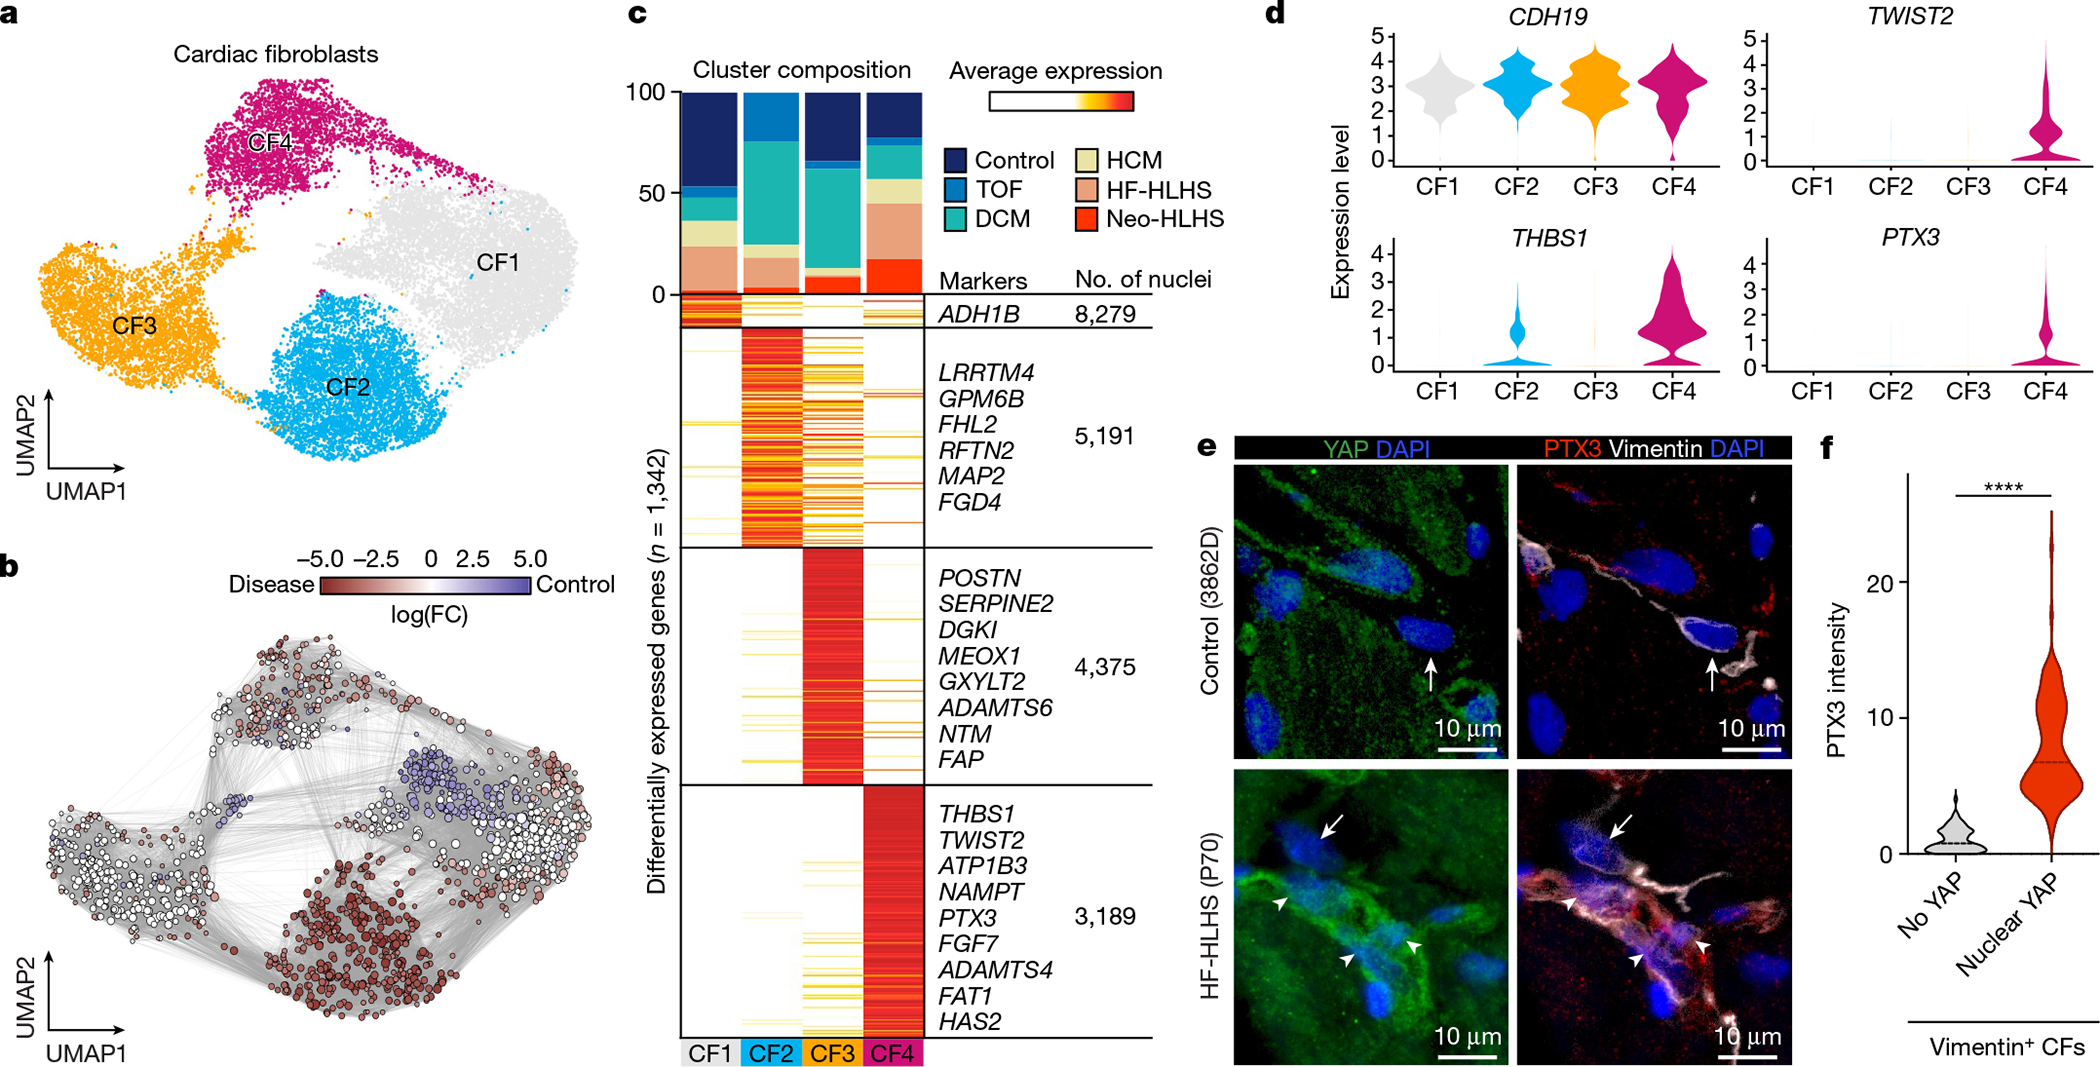
Fig. 3 |. Profiling of cardiac fibroblasts in paediatric patients.

a, UMAP embedding of cardiac fibroblast reiterative clustering. b, Embedding of Milo k-nearest neighbour differential abundance testing results for cardiac fibroblasts. All nodes represent neighbourhoods, coloured by log fold change for CHD versus controls. Neighbourhoods with insignificant log fold changes (FDR <10%) are shown in white. The layout of nodes is determined by UMAP embedding shown in a. c, Top, cluster composition plot indicating the percentage of cells from each diagnosis that contribute to each cluster. Bottom, average expression heat map with representative genes shown on the right. d, Violin plots showing expression levels for each cardiac fibroblast cluster, coloured according to the cluster designations in a.e, Representative YAP and PTX3 expression in vimentin-positive cardiac fibroblasts in an HF-HLHS sample. Arrows show cardiac fibroblasts without nuclear YAP and arrowheads denote nuclear YAP. f, Quantification of PTX3 intensity in cardiac fibroblasts that are negative (n = 73) and positive (n = 101) for nuclear YAP across fifteen samples (2 controls, 3 TOF, 2 neo-HLHS, 4 HF-HLHS and 4 DCM). Two-tailed Mann–Whitney test. ****P < 0.0001.
