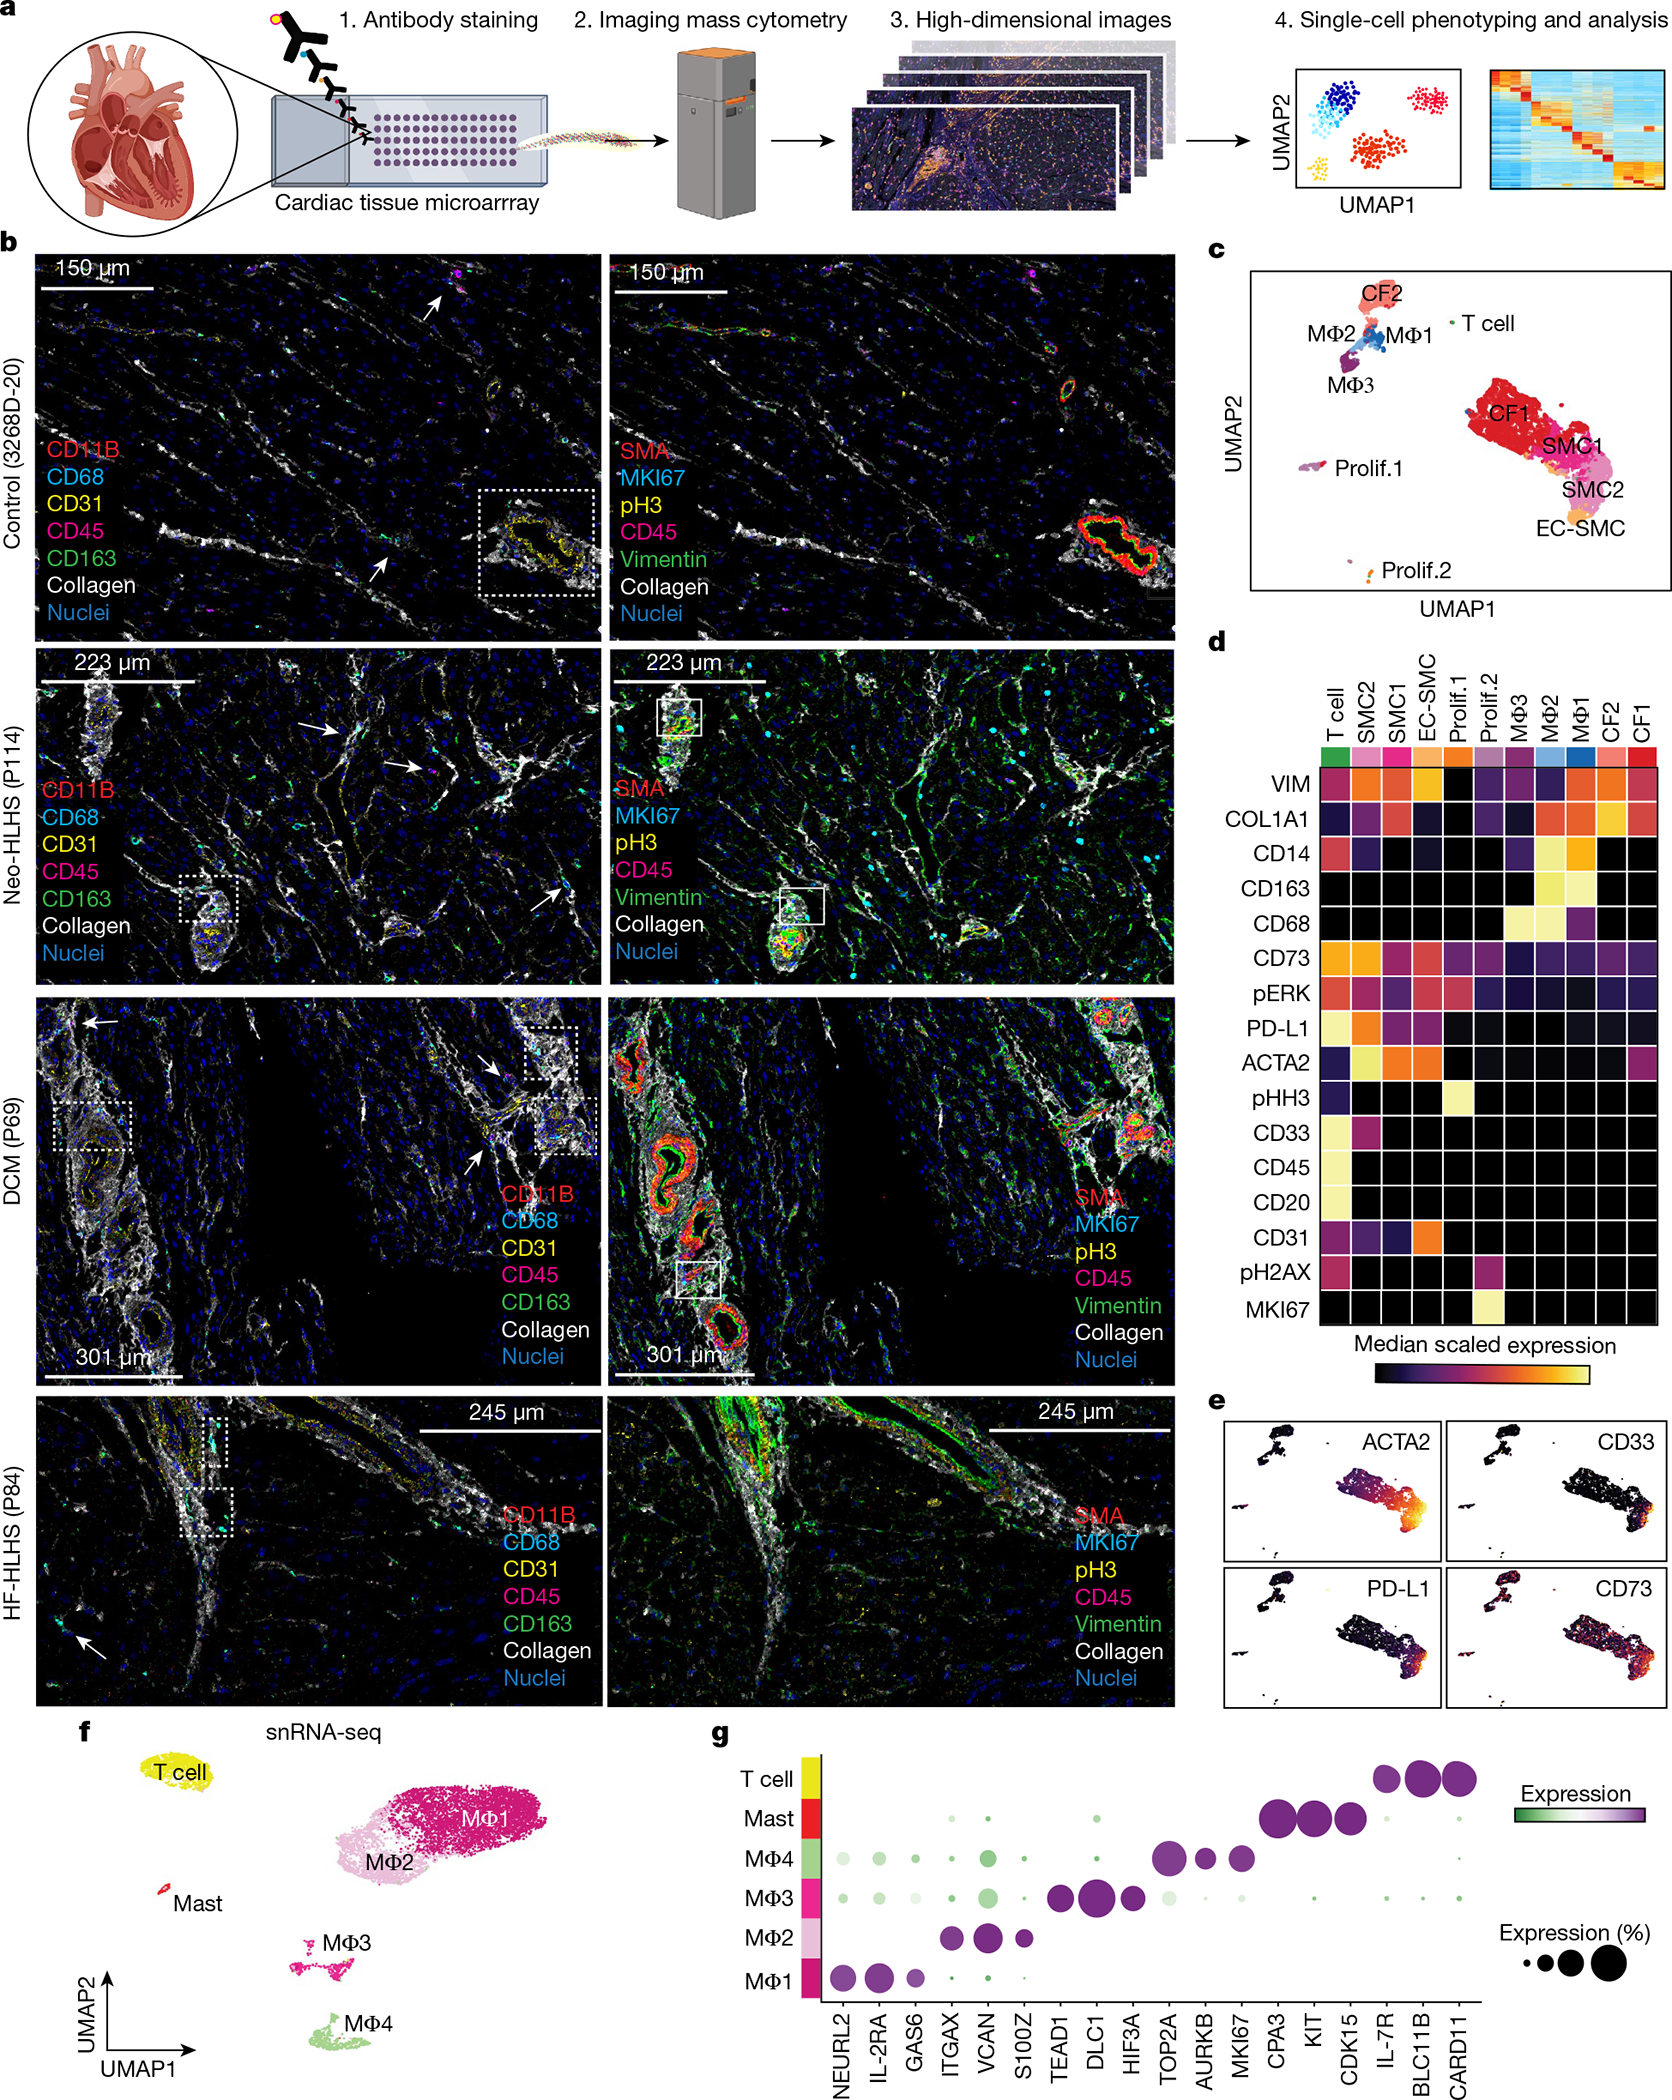
Fig. 5 |. High-dimensional histopathology of paediatric cardiac diseases.

a, Schematic of the IMC experimental and analytical workflow. b, Representative IMC images from the indicated patient samples. Dashed boxes indicate immune infiltrates in perivascular regions. Arrows indicate cells expressing immune marker CD45 and macrophage-specific markers (CD163, CD68 and CD11B). Solid boxes indicate cells expressing the proliferation marker MKI67 in perivascular regions. c, UMAP embedding of all IMC data, coloured by cluster. Prolif., proliferating cells. Total samples: 20 (1 Neo-HLHS, 8 HF-HLHS, 3 TOF, 8 DCM). d, Heat map displaying biomarker expression across each cell cluster. e, Plots showing biomarker expression from IMC. f, UMAP embedding of immune cell populations derived from cardiac tissue. g, Dot plot showing highly expressed markers for each immune cell population.
