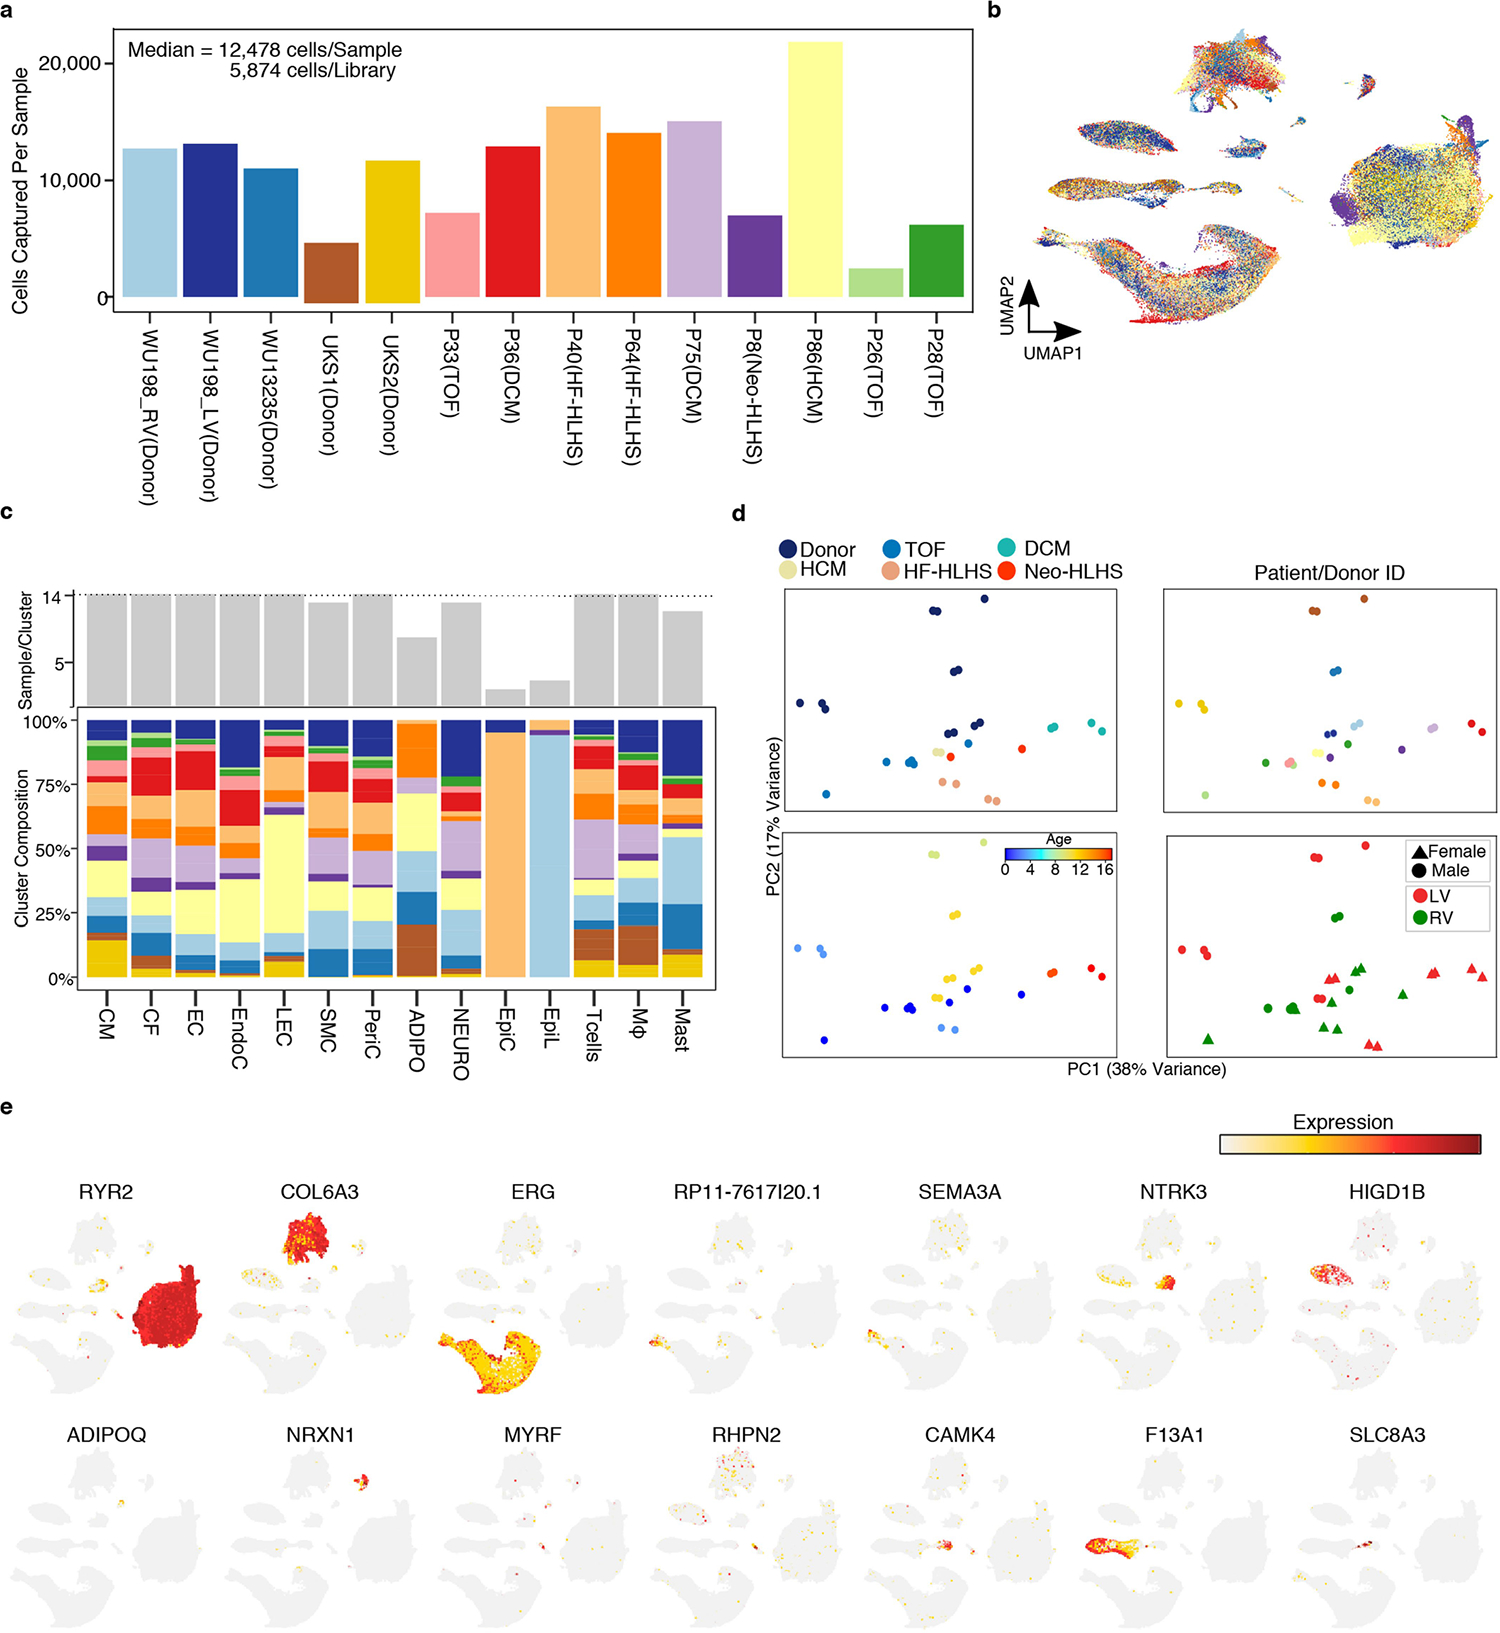
Extended Data Fig. 1 |. Cardiac tissue snRNA-seq profiling.

a, The number of nuclei detected per sample. Calculations for cell (nuclei) per library performed be dividing total number of nuclei by the number of technical replicates (libraries). b, UMAP showing sample identity. Colored according to Extended Data Fig. 1a. c, Cluster composition across cell types. (Top) Number of samples detected per cluster. (Bottom) Stacked bar graph indicating the percentage of each samples contribution to the indicated cluster. Colored according to Extended Data Fig. 1a. d, Pseduobulk RNA-seq from all cell types collapsed. All technical and biological and technical replicates (libraries) are shown. e, Feature plot showing expression of marker genes across global UMAP from Fig. 1b.
