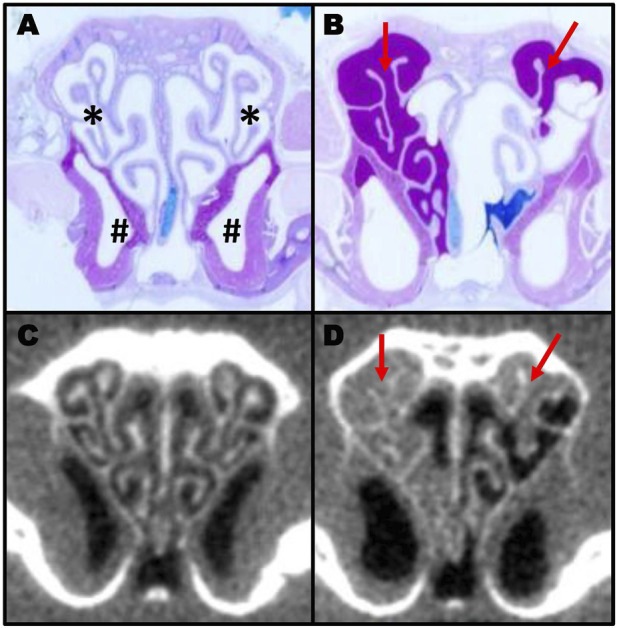
FIGURE 1.

Comparison of histology section and CT scans in murine sinusitis. AB-PAS-stained section of a control (A) and a PCD (B) mouse showing mucus accumulation (red arrows) in the PCD animal. The same animals were imaged by CT (C,D) prior to euthanasia to illustrate the correlation between CT scanning and histology for measuring mucus obstruction (A; * indicates the ethmoturbinate region; # indicates the maxillary sinus region).
