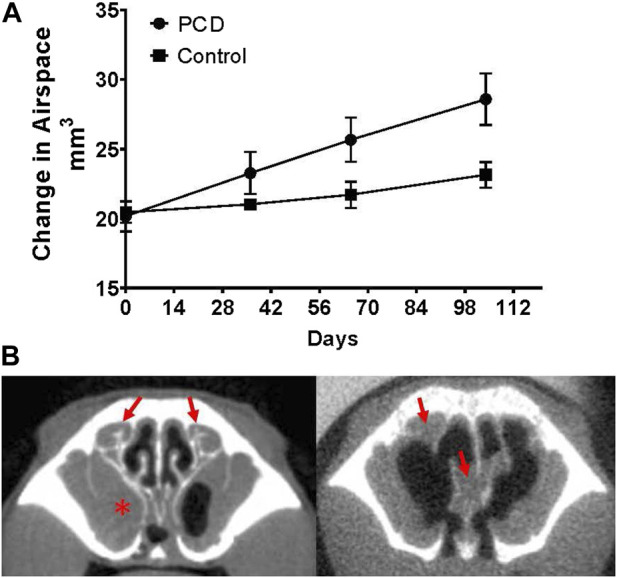
FIGURE 3.

Changes in nasal airspace measured by CT imaging over time. (A) Groups of PCD (n = four males and three females) and littermate control mice (n = two males and two females) were repeatedly imaged by CT at monthly intervals beginning at ∼7 weeks of age. Although PCD mice demonstrate mucus accumulation in the nasal cavity over this time, the nasal airspace increases compared to the control (p = 0.0415). (B) Representative images of a mouse with mucus accumulation (left; arrows indicate mucus accumulation in the ethmoturbinate region, and asterisk indicates the mucus-occluded sinus cavity) compared to a mouse with severe remodeling/degeneration resulting in an increase in nasal airspace, even though accumulated mucus is still present (arrows).
