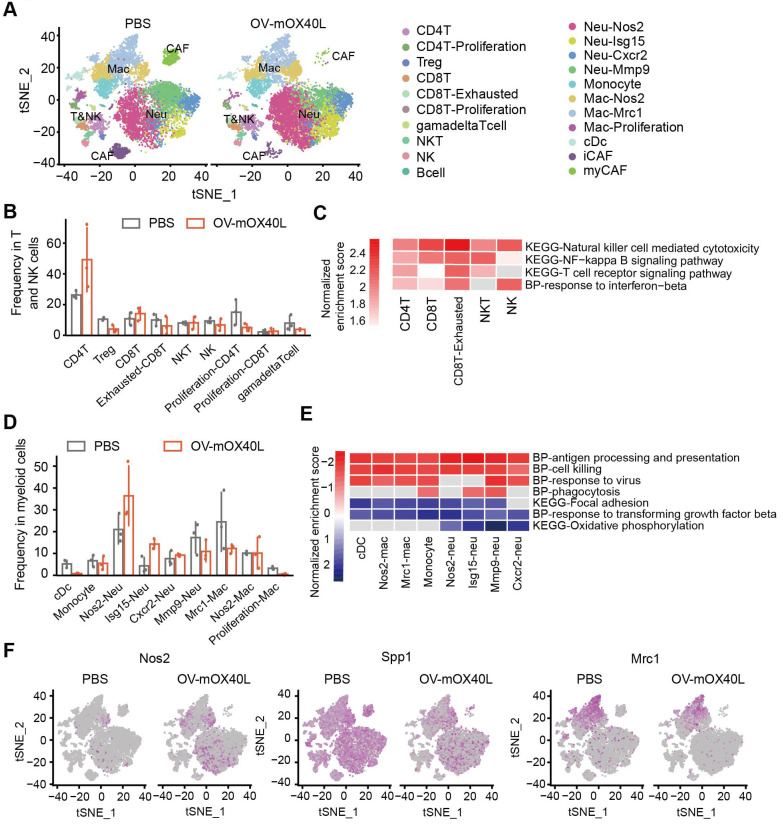
Figure 4.
Single-cell RNA sequencing analysis of the tumor-infiltrating immune cells after OV-mOX40L treatment. A) All tumor-infiltrating immune cells from PBS and OV-mOX40L treated mice were clustered and showed as tSNE plots. Tumor-infiltrating immune cells were isolated from 3 mice per group and labeled with hashtag antibodies, then mixed in equal numbers for single-cell RNA sequencing. B) The proportions of intratumoral T and NK cells in the PBS and OV-mOX40L groups. C) GSEA pathway enrichment of OV-mOX40L versus PBS in individual CD8+ T cell, CD4+ T cell, NK and NKT cell clusters. D) The proportions of myeloid cells in the PBS and OV-mOX40L groups. E) GSEA pathway enrichment of OV-mOX40L versus PBS in individual neutrophils, macrophages and cDC clusters. F) Expression of pro-inflammatory marker gene (Nos2) and immunosuppressive marker genes (Spp1 and Mrc1) in the tSNE plot.

