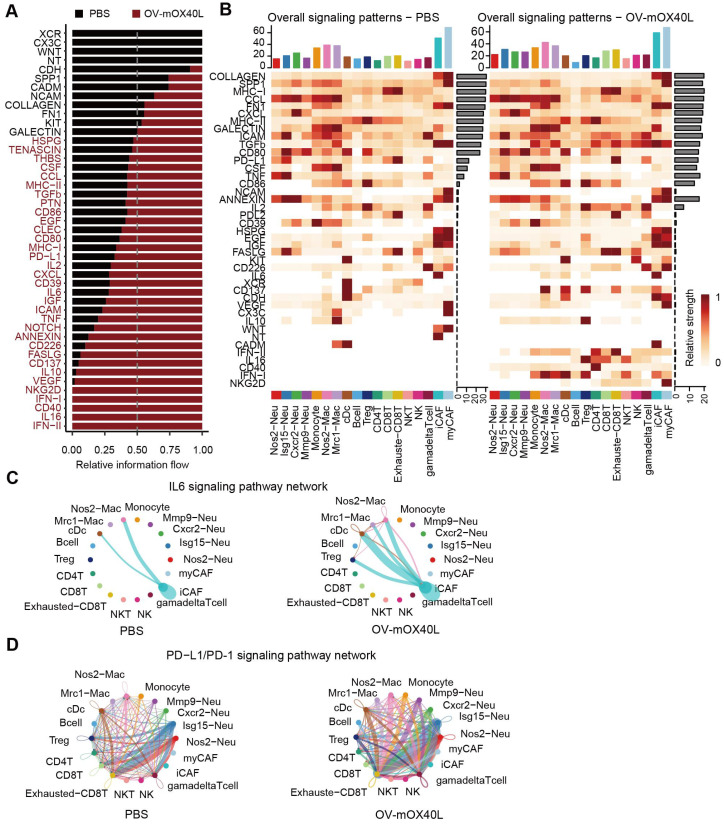
Figure 5.
Identification of major signaling changes after the OV-mOX40L therapy. A) Normalized interactions were summed as the overall information flow and significantly different signaling pathways were identified between the PBS and OV-mOX40L groups. B) The overall signaling patterns among our defined cell clusters in the PBS group and the OV-mOX40L group. C and D) The inferred IL6:IL6R/gp130 (C) and PDCD1: PD-L1 (D) signaling network among the cell populations represented by the nodes. The edge width represents the interaction strength of the specific pathway.

